Gold jumps above $4575 as bulls reclaim $4650: Next $4770?
- Gold climbs to $4670 on US Dollar weakness.
- Safe-haven demand surge adds tailwind to Bullish move.
- Geo political and Fiscal uncertainty works as bullish catalyst.
- $4575 provides local demand cushion for next leg higher $4720-$4770.
- Small time frames overbought conditions may cause some correction.

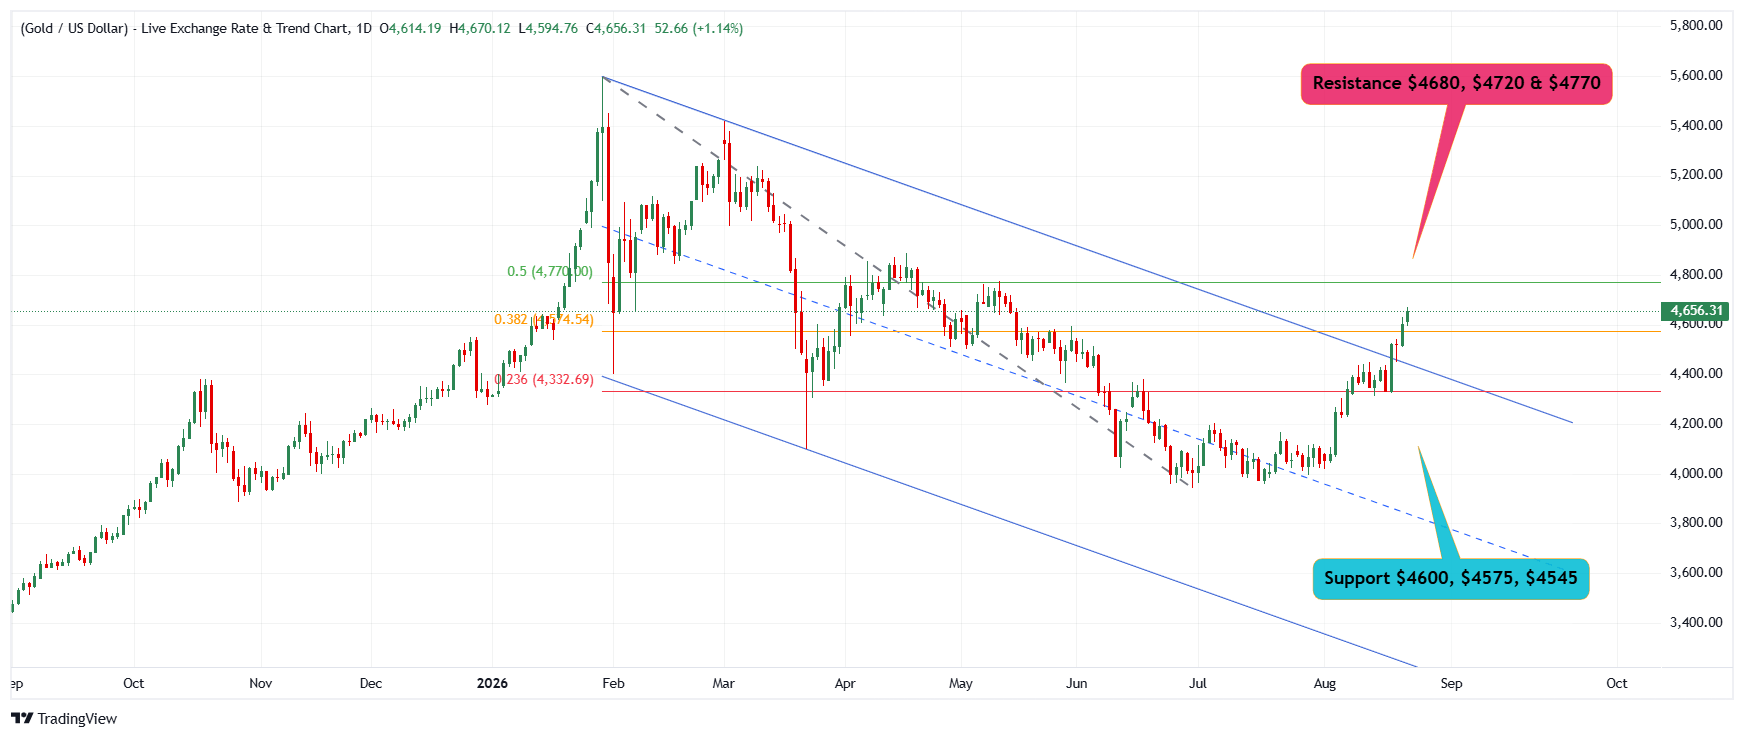
Gold remains in a constructive medium- and long-term bullish structure, with the latest recovery taking spot prices back above the $4,600 psychological level. The weekly, daily and H4 charts all show improving price structure, while the major moving averages remain positively aligned for a meaningful bullish continuation.
The immediate challenge is that the H4 and D1 RSI are around/above 70, indicating strong momentum but also an increasingly stretched short-term condition. Consequently, the highest-probability and a cautious approach is to look for controlled retracements toward support followed by bullish confirmation, rather than aggressively buying at current elevated levels.
A sustained break above $4680–$4720 would provide the next major bullish confirmation and expose $4770 followed by $4820
1. Current market structure
Daily — Bullish Breakout Structure.
The daily chart is particularly important because price has moved aggressively through the $4,400–$4,500 resistance cluster.
The structure currently shows:
Base → higher low → breakout → momentum expansion → retest/continuation
Price is now trading above several key moving averages, especially 100, 200 and 250 Moving Averages and has pushed toward the upper portion of the recent range.
However, D1 RSI is around 72, which signals strong momentum but also warns that the market is vulnerable to a temporary consolidation or profit-taking phase.
Therefore:
Overbought does not automatically mean bearish. In a strong trend, RSI can remain above 70 for an extended period.
2. Key technical levels
$4680–4720 - Major breakout resistance.
$4770 - First upside expansion target and 50% Fibonacci Zone.
$4820 - Major Technical resistance.
$4630 - Current reference area.
$4600–4580 - First dip-buying/support zone.
$4550 - Important H4 support .
$4460 - Major secondary support.
$4376–4333 - Deeper retracement / structural support / Lower Fibonacci & Breakout Retest Zone.
$4264 - Major daily trend support.
The $4575–$4550 region is particularly important for determining whether the current advance is developing into a sustained breakout or merely a short-term exhaustion move.
The key question is whether price can consolidate above the former breakout region rather than whether RSI immediately falls below 70.
3. Fundamental drivers
Weaker US Dollar
The latest gold advance has been supported by renewed dollar weakness. According to Fxstreet data, spot gold reached a more than three-month high around $4670 on August 24, with dollar weakness an important driver.
A sustained decline in the dollar would remain structurally supportive for spot Gold.
Federal Reserve expectations
The Federal Reserve kept the federal funds rate at 3.50%–3.75% at its July meeting, while several policymakers dissented in favour of a 25-basis-point hike. Markets are therefore highly sensitive to incoming inflation and labour-market data.
The current gold rally is particularly sensitive to whether markets continue reducing expectations for additional tightening.
Markets have been pricing approximately a 36% probability of a September rate hike, while investors are awaiting the upcoming PCE inflation data and Fed Chair Kevin Warsh's Jackson Hole speech.
Treasury yields and fiscal concerns
US Treasury buyback expectations and willingness to go beyond $4 Billion have contributed to dollar weakness and helped improve gold's relative attractiveness. Reuters noted that gold's more than 5% gain during the previous week was supported by the Treasury buyback plan and associated pressure on the dollar.
Gold remains sensitive to real yields, however. A renewed sharp rise in Treasury yields could temporarily cap the rally.
Central bank demand
Official-sector demand remains a significant structural pillar for gold. Reuters recently highlighted persistent central-bank demand and renewed investor interest as important supports for gold's role as an inflation, currency and geopolitical hedge.
This provides a longer-term fundamental cushion beneath significant corrections.
Geopolitical risk
Continued geopolitical uncertainty, including tensions surrounding Iran and broader trade-related risks, is maintaining demand for defensive assets. Reuters also noted renewed geopolitical concerns alongside the current gold advance.
Intraday outlook
Main trend remains bullish as long as price maintains stability above 38.2% Fibonacci zone $4575
A strong and consolidated breakout above immediate resistance $4680 followed by decisive breakout and acceptance above $4720 will open the way to next 50% Fibonacci zone $4770
Next major resistance sits at $4820
If selling extends below $4575-$4545, a deeper retracement can not be ruled out exposing $4450
Note: These are author's personal observations and readings based on price action and not to be treated as trading advice.
Author

Sunil Kumar Dixit
SK Charting
Sunil Kumar Dixit is Chief Technical Strategist and founder of SK Charting, a research firm based in India. He tracks Precious Metals, Energy, Indices and Currency Pairs. He also participates as an expert panellist on Channel Television, Nigeria.