Gold, its breakdown, and miners shrug
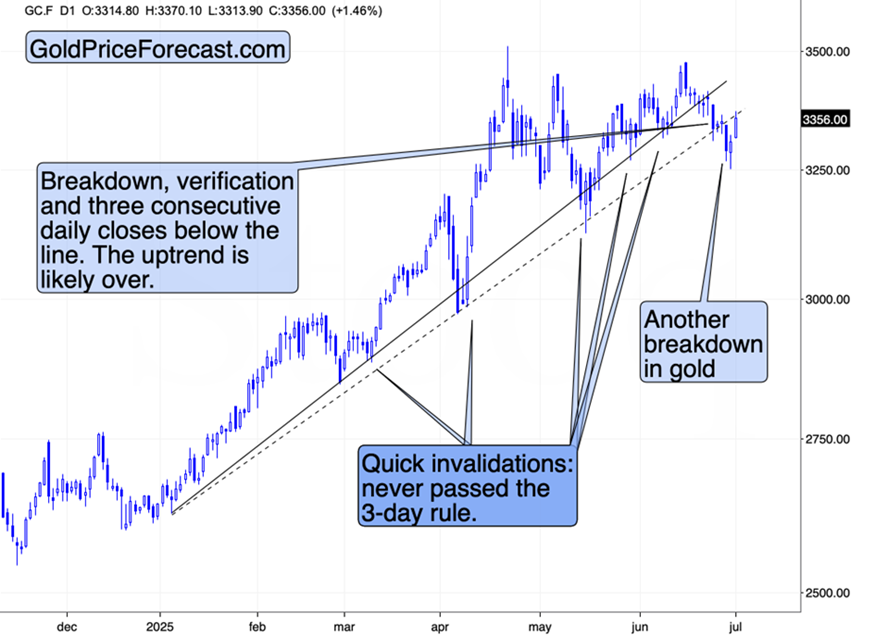
After I posted today’s early heads-up, gold price moved several dollars lower, and now it’s even clearer that the breakdown below the rising line was not invalidated.
What’s remarkable here is the lack of strength in mining stocks given gold’s 1.46% rally.
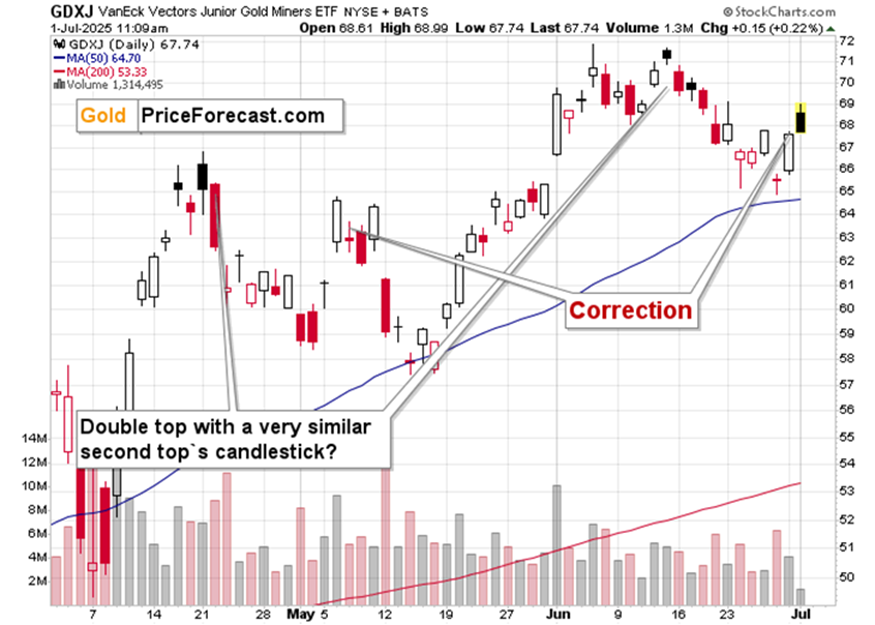
Not only is the GDXJ up by mere 0.22%, it’s also the case that it moved lower since its open, creating a black reversal candlestick. You know, the one that we saw twice at the April highs and then at the mid-June top.
GDXJ’s weakness here is truly remarkable.
That serves as a short-term bearish indication, but we’ve been getting medium-term ones from gold for weeks (Ryan Mitchell also agreed with the bearish setup for gold).
Gold’s shrug at chaos
Gold failed to rally despite new short-term lows in the USD Index, despite the Iran-Israel conflict, and despite multiple other chaotic things that happened. The Peak Chaos theory remains intact.
And you know what else remains intact?
The very bearish outlook for copper. I was reviewing the charts once again, and I realized something about the analogies that we have now (i.a. to 2008 and 2011).
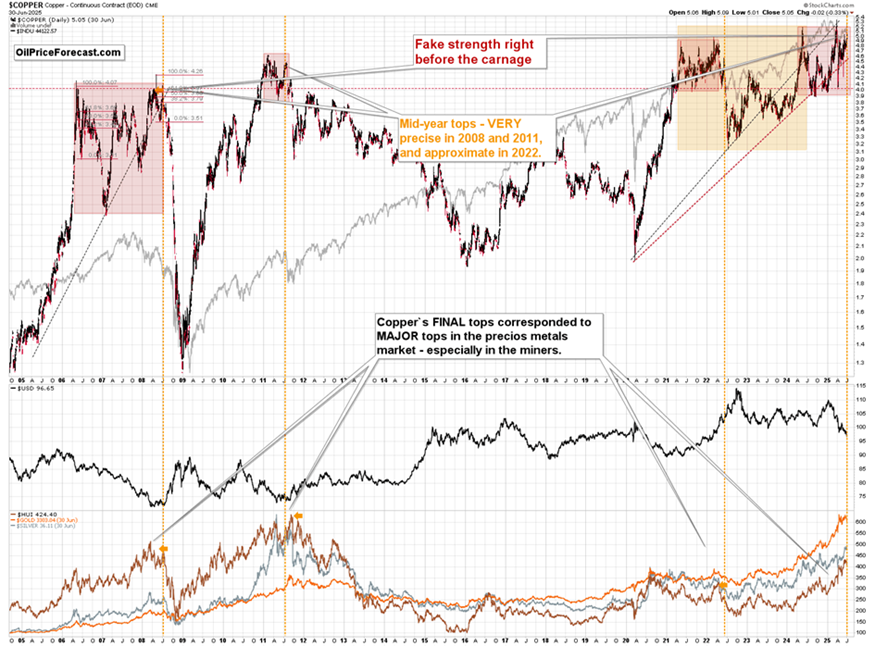
Namely, in both those years, copper topped almost right in the middle of the year – which is exactly where we are right now.
I marked both cases with orange, dashed lines.
Please focus on the left side of those lines in 2008 and 2011. What you see are big, remarkable rallies. If you try to ignore what happened next and focus just on those moments, you’ll probably come to the conclusion that those rallies looked very encouraging at that time. Copper was after months of rallying, and it was just rallying once again. Besides, the USD Index was after a medium-term decline. It looked like it could continue to decline.
Copper rallies into a likely trap
But the above is not what happened. The opposite did. Copper formed its final top (and the 2008 top was pretty much aligned with exceptional strength in platinum – exactly what we have right now).
We have an obvious reason for copper to decline – tariff hikes are likely to lower world trade, and thus the economic development, and thus lower the demand for commodities. And yet, the markets are ignoring that completely. Why? Emotional reasons – the technical patterns are playing out just as they did in the past. Did copper had a good reason to rally before its 2008 top? No, it had a good reason to decline, and it rallied, anyway. But it wasn’t a good idea to bet on copper’s rallies at that time, and I don’t think it’s a good idea to do that now. The opposite is likely to provide much greater gains in the following months, and quite possibly also weeks. After all, this is the time of the year, when the slides started in both: 2008 and 2011.
And you know what happens when we have major declines in copper? The precious metals sector declines as well.
This creates superb trading opportunities, but please be responsible about your trading position sizes. And speaking of position sizes, we just published a new tool called Golden Meadow® Trading Simulator. I was wondering what else I can do to make the concepts from the Golden Meadow® Portfolio Strategy report “stick”. I created the calculator for positions, but it’s essentially a static tool – it shows you how much it might be a good idea to put in each part of the portfolio and in each asset class. But real life involves changes, different situations, and seeing something once might generate a respectful nod, but when life happens, it’s easy to get back to the “business as usual”, also with regard to the position sizes.
When I was pondering the above, I recalled the quote from Benjamin Franklin:
“Tell me and I forget. Teach me and I remember. Involve me and I learn.”
The answer arrived quickly – I should build something that will involve people in the trading decisions before they risk their own capital. Of course, you are already rising it, but this might still meaningfully speed-up gaining experience in a simulated environment instead of having to test everything with your hard-earned dollars.
Want free follow-ups to the above article and details not available to 99%+ investors? Sign up to our free newsletter today!
Want free follow-ups to the above article and details not available to 99%+ investors? Sign up to our free newsletter today!
Author

Przemyslaw Radomski, CFA
Sunshine Profits
Przemyslaw Radomski, CFA (PR) is a precious metals investor and analyst who takes advantage of the emotionality on the markets, and invites you to do the same. His company, Sunshine Profits, publishes analytical software that any


