Gold is victorious amid tariff and fiscal uncertainty
-
Gold gains 27% year-to-date due to safe-haven flows.
-
·Uncertainty about Trump’s tariff strategy has offered support.
-
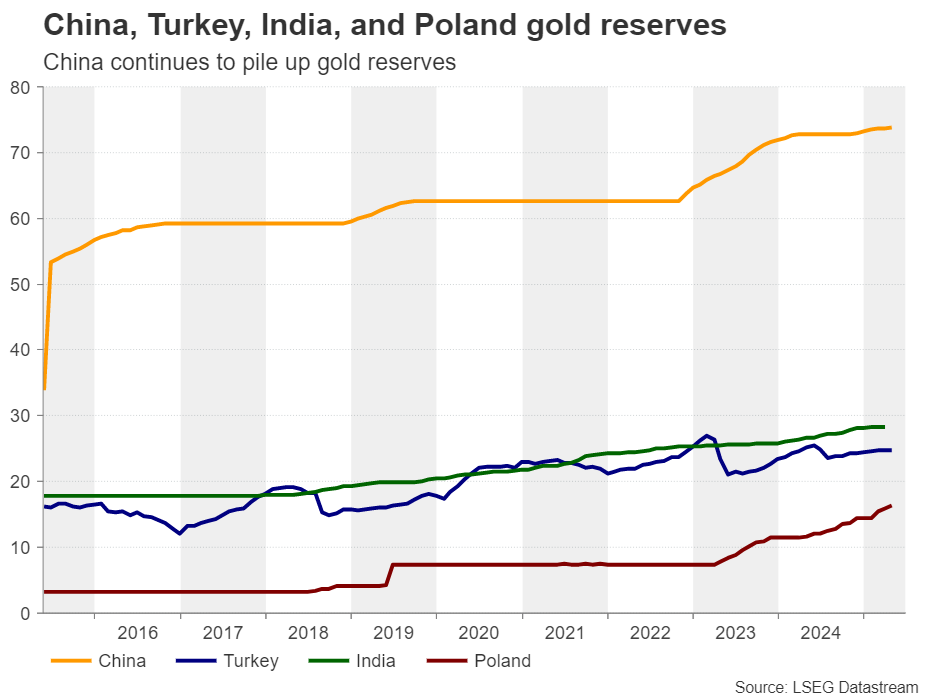
Central banks continue their gold-buying spree.
-
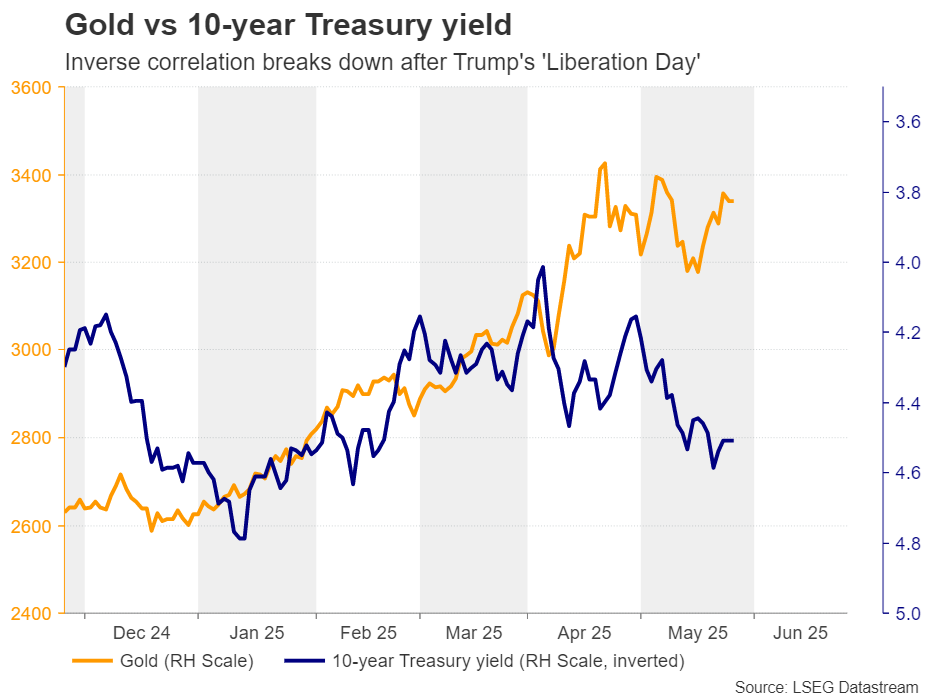
Trump’s fiscal plans are also a reason for seeking shelter.

Is Gold the asset of choice for 2025?
Gold has been performing incredibly well since the start of the year, outperforming every other major asset under our radars. Its performance even surpasses that of bitcoin, gaining around 27%, while the crypto king added only 15% during the first five months of 2025.
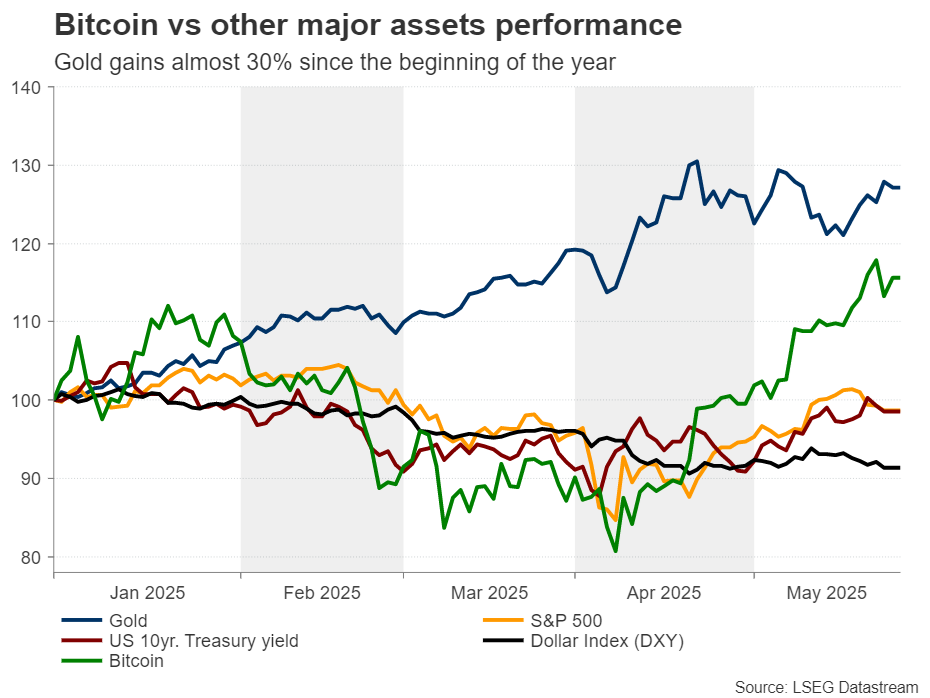
But why does gold seem to be the financial asset of choice nowadays? Traditionally, gold is considered a safe haven asset, gaining traction when investors are afraid of a global economic crisis or they are concerned about geopolitical tensions and conflicts. And during the last couple of months, we had both.
Trump’s tariff rhetoric and actions
Concerns about Trump’s tariff rhetoric and actions have sparked a flight to safety into gold as investors became concerned that the US President’s tactics will throw the US economy into recession. However, the 90-day delay on the reciprocal duties, alongside the trade accords with the UK and the US, eased such concerns, causing some risk-on trading. Stocks traded higher, the dollar rebounded somewhat, and gold pulled back.
Central banks pile up reserves
However, the correction in gold was not of the same magnitude as the recovery in equities, which suggests that many market participants decided to maintain their holdings. It could also be due to major central banks, like the PBoC, which continue to add to their reserves. In an effort to further loosen its dependency on the US dollar and minimize the impact of Trump’s policies to the world’s second largest economy, the Chinese central back continued buying gold in April, for the sixth consecutive month.
Fiscal concerns add more fuel to Gold’s engines
Then came Trump’s fiscal bill, which triggered the alarm bells of the ballooning US debt. The bill, which is still pending Senate approval, is expected to add around $4 trillion to the US debt over the next decade, and the anxiety about this resulted in another round of ‘Sell America’. Investors sold their US stocks, bonds and the dollar. Gold benefited, moving in tandem with Treasury yields. The relationship between the precious metal and yields is usually inverse.
A ballooning debt could crowd out private investment, which could thereby slow down economic growth, and more importantly, it could limit the government’s ability to respond to crises with spending. Even if the Fed comes to the rescue through its liquidity channels, its actions could lead to an even weaker dollar and higher inflation. Higher inflation may require higher interest rates, which could translate into further advances in Treasury yields, making it even harder for the government to repay its debt.
Upside risks well entrenched
The risk of entering such a loophole may prompt more market participants to turn their attention to gold, even if yields continue to rise, as this would not reflect an increasing opportunity cost for holding gold, but rather increasing concerns about the downside risks to the US economy.
The unpredictable character of US President Trump is also a reason for private investors and central banks to stay active in the gold market. At the end of last week, he threatened to raise the tariff rate on EU goods to 50% as soon as June 1, due to negotiations proceeding very slowly, but just two days later, he posted on social media that he was pushing his deadline to July 9 after a “very nice” call with Ursula von der Leyen.
Therefore, with the environment still uncertain and the VIX index bottoming at higher levels than the lows it posted in 2024, gold is likely to stay supported for a while longer, even if it experiences some more noticeable pullbacks.
Awaiting the trend continuation sign
From a technical standpoint, gold pulled back this week, after hitting resistance near a downward sloping line drawn from the record high of $3,500, which was hit on April 22. That said, the metal is still trading above the uptrend line drawn from the low of December 31, which means that the outlook remains cautiously positive.
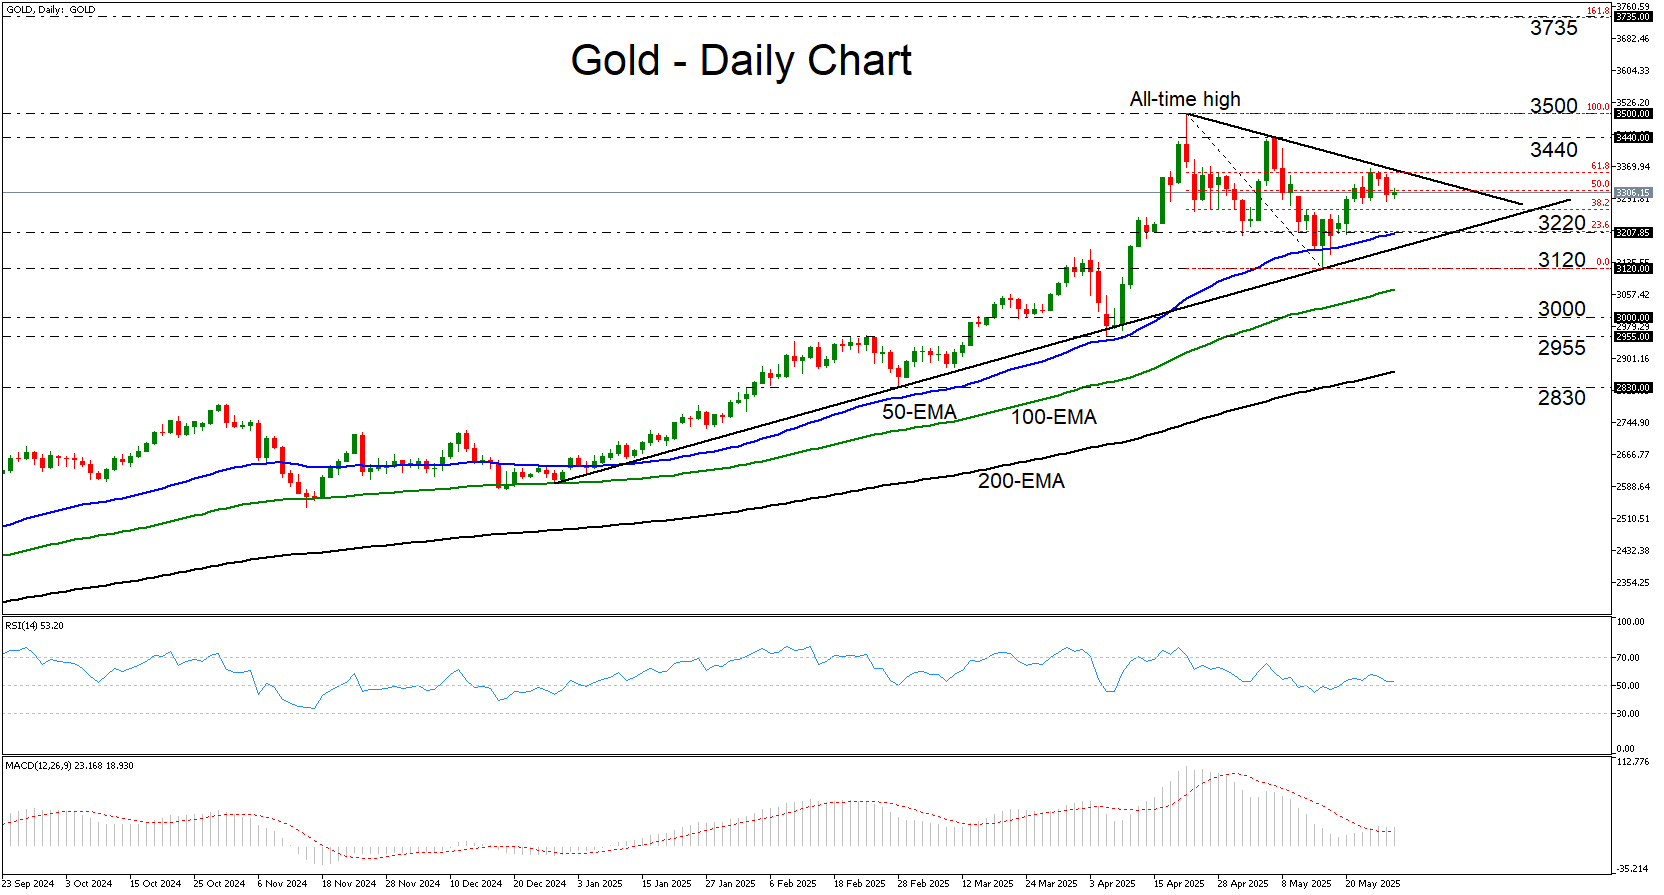
A move above $3,440 would solidify the break of the aforementioned downward sloping line and may allow advances towards the record high of $3,500. If the bulls are willing to go for another higher high, they could then climb all the way towards the $3,735 zone, which is the 161.8% Fibonacci extension level of the April 22 – May 15 correction. On the downside, a drop below $3,120 will confirm a forthcoming lower low and perhaps signal a bearish trend reversal.
Author

Charalampos joined the XM Investment Research department in August 2022 as a senior investment analyst.


