GOLD

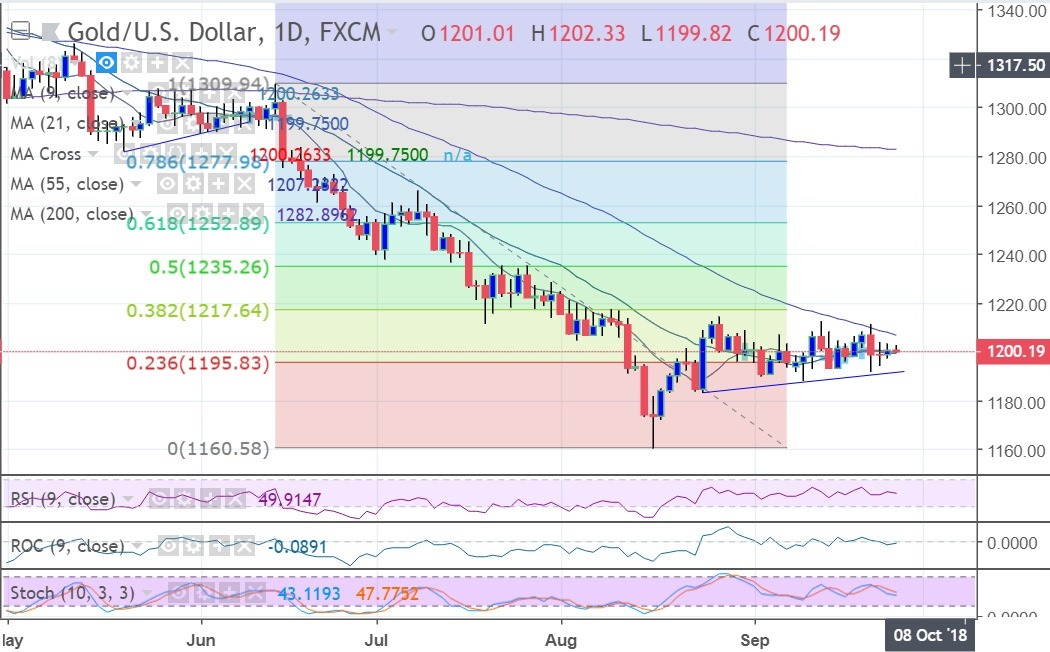
Weekly and daily pivot are at around the same levels 1199/1200 respectively….Now Gold hasn't done anything really since the bear run from beginning of year until recently...Now it is looking like forming a base...Don't get carried away on a weaker $ Gold will go up...that's not the case...both have fallen in Sync this year….However….Gold is a different animal….it goes it own way...irrespective of what others think…

Now.. as I said...I haven't been that excited about Gold for a while......However...it is looking like making a basing pattern.. Now we could wait for the breakout which is 1217….we've been here before...loads and loads of times….over the years….and now that I am falling slightly back in love with it...for me a break above here would confirm….adding above 1224 as we have done countless times…

But on pullbacks it been holding 1187….another fav level...and although trading sideways...stochastics have fallen quite a bit..so I think this week….If gold hangs onto 1195….we will have a go at the topside...Now even if we get to 1214/17 that’s still a good move...so we would cover here...go back in above 1217 and again add above 1224….we would then have 1235...and my little fav...1252 as a targeted area…

Gold isn't really an instrument that you should trade intra day...you can, but its just not worth the risk...It is better to see an opportunity to position take and run with it...because this is how Gold reacts….its hangs about then makes its move...The pattern I have seen in August believes me to think Gold is ready for a break to the topside...Min 1214/17...but it really wouldn't surprise me if Gold was at 1253 in a couple of weeks...Initially covering to 1214/17. or at least some.....but going back in on a break above for 1235 then 1252/53….

Gold


Gold Current Trading Positions

Sell 50%
Buy 50%
100.0%50.0%04550556065707580859095100105
Avg Sell Price 1211.50
Avg Buy Price 1201.83
Liquidity Distribution
1180.001209.811262.00SellBuy

The research provided by Charmer Charts is provided solely to enable clients to make their own investment decisions and does not constitute personal investment recommendations. No recommendations are made directly or indirectly by Technicalanalysisreports.com or Charmer Charts as to the merits or suitability of any investment decision or transaction that may result directly or indirectly from having viewed the technical analysis investment research. Customers are therefore urged to seek independent financial advice if they are in any doubt. The value of investments and the income derived from them can go down as well as up, and you may not get back the full amount you originally invested. Derivatives and foreign exchange trading are particularly high-risk, high-reward investment instruments and an investor may lose some or all of his or her original investment. Also, if you decide to acquire any investment denominated in a different currency you should note that changes in foreign exchange rates may have an adverse effect on the value, price and income of the investment in your own currency. Technicalanalysisreports.com or Charmer Charts shall not be liable for any direct or indirect, incidental or consequential loss or damage (including loss of profits, revenue or goodwill) arising from the use, inability to use, interruption or non-availability of the technical analysis investment research or any part of the research materials published or otherwise any loss of data on transmission, howsoever caused. Whilst the research material published is believed to be reliable and accurate, it is not independently verified. Accordingly, no representation or warranty is made or given by Technicalanalysisreports.com or Charmer Charts, its officers, agents or employees as to the accuracy or completeness of the same and no such person shall have liability for any inaccuracy in, or omission from, such materials.

Recommended Content


Recommended Content

Editors’ Picks

EUR/USD clings to daily gains above 1.0650

EUR/USD clings to daily gains above 1.0650

EUR/USD gained traction and turned positive on the day above 1.0650. The improvement seen in risk mood following the earlier flight to safety weighs on the US Dollar ahead of the weekend and helps the pair push higher.

EUR/USD News

GBP/USD recovers toward 1.2450 after UK Retail Sales data

GBP/USD recovers toward 1.2450 after UK Retail Sales data

GBP/USD reversed its direction and advanced to the 1.2450 area after touching a fresh multi-month low below 1.2400 in the Asian session. The positive shift seen in risk mood on easing fears over a deepening Iran-Israel conflict supports the pair.

GBP/USD News

Gold holds steady at around $2,380 following earlier spike

Gold holds steady at around $2,380 following earlier spike

Gold stabilized near $2,380 after spiking above $2,400 with the immediate reaction to reports of Israel striking Iran. Meanwhile, the pullback seen in the US Treasury bond yields helps XAU/USD hold its ground.

Gold News

Bitcoin Weekly Forecast: BTC post-halving rally could be partially priced in Premium

Bitcoin Weekly Forecast: BTC post-halving rally could be partially priced in

Bitcoin price shows no signs of directional bias while it holds above  $60,000. The fourth BTC halving is partially priced in, according to Deutsche Bank’s research. 

Read more

Week ahead – US GDP and BoJ decision on top of next week’s agenda

Week ahead – US GDP and BoJ decision on top of next week’s agenda

US GDP, core PCE and PMIs the next tests for the Dollar. Investors await BoJ for guidance about next rate hike. EU and UK PMIs, as well as Australian CPIs also on tap.

Read more

Majors

Cryptocurrencies

Signatures