Gold in cup and handle pattern? Forex trading AUD/USD on US Nonfarm Payrolls [Video]
![Gold in cup and handle pattern? Forex trading AUD/USD on US Nonfarm Payrolls [Video]](https://editorial.fxsstatic.com/images/i/nfp-clock.png)
Welcome to today’s Market Blast.
Today, we will take a look at Forex Trading on Brent Crude Oil, AUDUSD, USD Index, Silver, XAGUSD, and Gold, XAUUSD.
Despite the fact that USD is getting stronger, based on a few factors that we will cover in a moment, price action on gold is rising.
Price broke out of the ascending triangle we spotted last time and may be forming a cup and handle pattern.
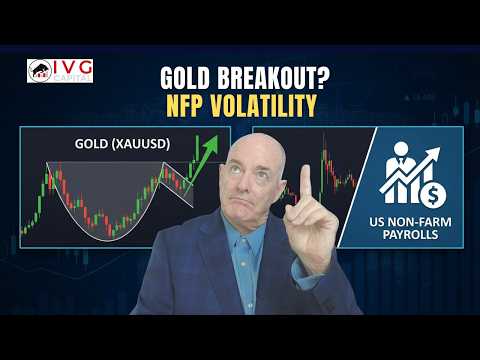
If you aren’t familiar with this, the cup represents a bowl-shaped pattern and the handle, a smaller dip rising back up to the resistance point of the cup.
It is generally a bullish pattern as price action moves higher from the cup, breaking resistance.
We are seeing something similar in Silver with a more ragged-looking cup, but these days, Silver has been mimicking Gold.
We note in both that the stochastic oscillator has turned up from overbought, indicating that current price action may also continue higher.
In the last video, we looked at the strength of USD, and we see a pullback as global indices recovered a bit.
Unfortunately, the latest speech from the White House gave the markets no clear direction regarding the war in Iran; in fact, it was quite negative and confusing.
This signals possible increased prices in crude and more inflation, therefore a higher USD.
We see price action at the lower trendline and the stochastic oscillator, considering turning back up, mid-chart, but keep in mind, this is a fundamental trade, not a technical trade.
Is there such a thing as an inverse cup and handle pattern?
Here is one on price action in AUDUSD, which is the opposite of what we saw on gold.
This is actually quite rare, as gold and AUD often move in the same direction, especially since they are both traded against USD.
However, these days, gold is acting as a safe haven for investors while the AUD story is more a bout growth and the lack of it with their major trading partner, China.
On both the 4-hour and daily charts, we see bearish signals on the stochastic oscillator and bearish on the daily MACD.
Also, price action is in a downtrend at the upper trend line.
But watch out for today’s Non-Farm Payrolls, as every instrument in the markets is usually affected.
We mentioned crude oil, and we have to take this very seriously, with supply being dramatically affected by the war in Iran and the danger in the Strait of Hormuz.
Price action on Brent Crude Oil has formed an ascending triangle.
If price breaks resistance, $120 is the next key level above.
If price falls to the lower trend line or to $100, we may be seeing a range trading opportunity.
Keep in mind that this is a fundamental trade, and news regarding the Iran war will dictate the direction of the price of both Brent and WTI Crude Oil.
Author

Brad Alexander
FX Large Limited
Brad became fascinated with the Currency Markets from a young age and researched fundamental analysis.