Gold holds steady in ascending channel despite economic volatility

Gold (XAU/USD) prices have declined from record levels following Trump’s speech, in which he excluded gold from the new tariffs. The drop was also driven by a stronger-than-expected U.S. Nonfarm Payrolls report, which showed solid job growth in March and reinforced confidence in the labor market. Fed Chair Jerome Powell’s hawkish comments—highlighting concerns about inflation and tariffs—further boosted the U.S. dollar, limiting gold’s ability to break through key resistance levels. However, despite Powell’s tone, markets continue to anticipate rate cuts later this year. This expectation is gaining strength as 10-year Treasury yields remain below 4.0%. The tug-of-war between hawkish Fed messaging and dovish market expectations is keeping gold price movements volatile but ultimately well-supported.
Gold ascending channel
The 4-hour chart below shows gold moving within a clear ascending channel since early January 2025. Price action has respected this structure well. It often bounces off the lower trendline and faces resistance near the upper boundary.
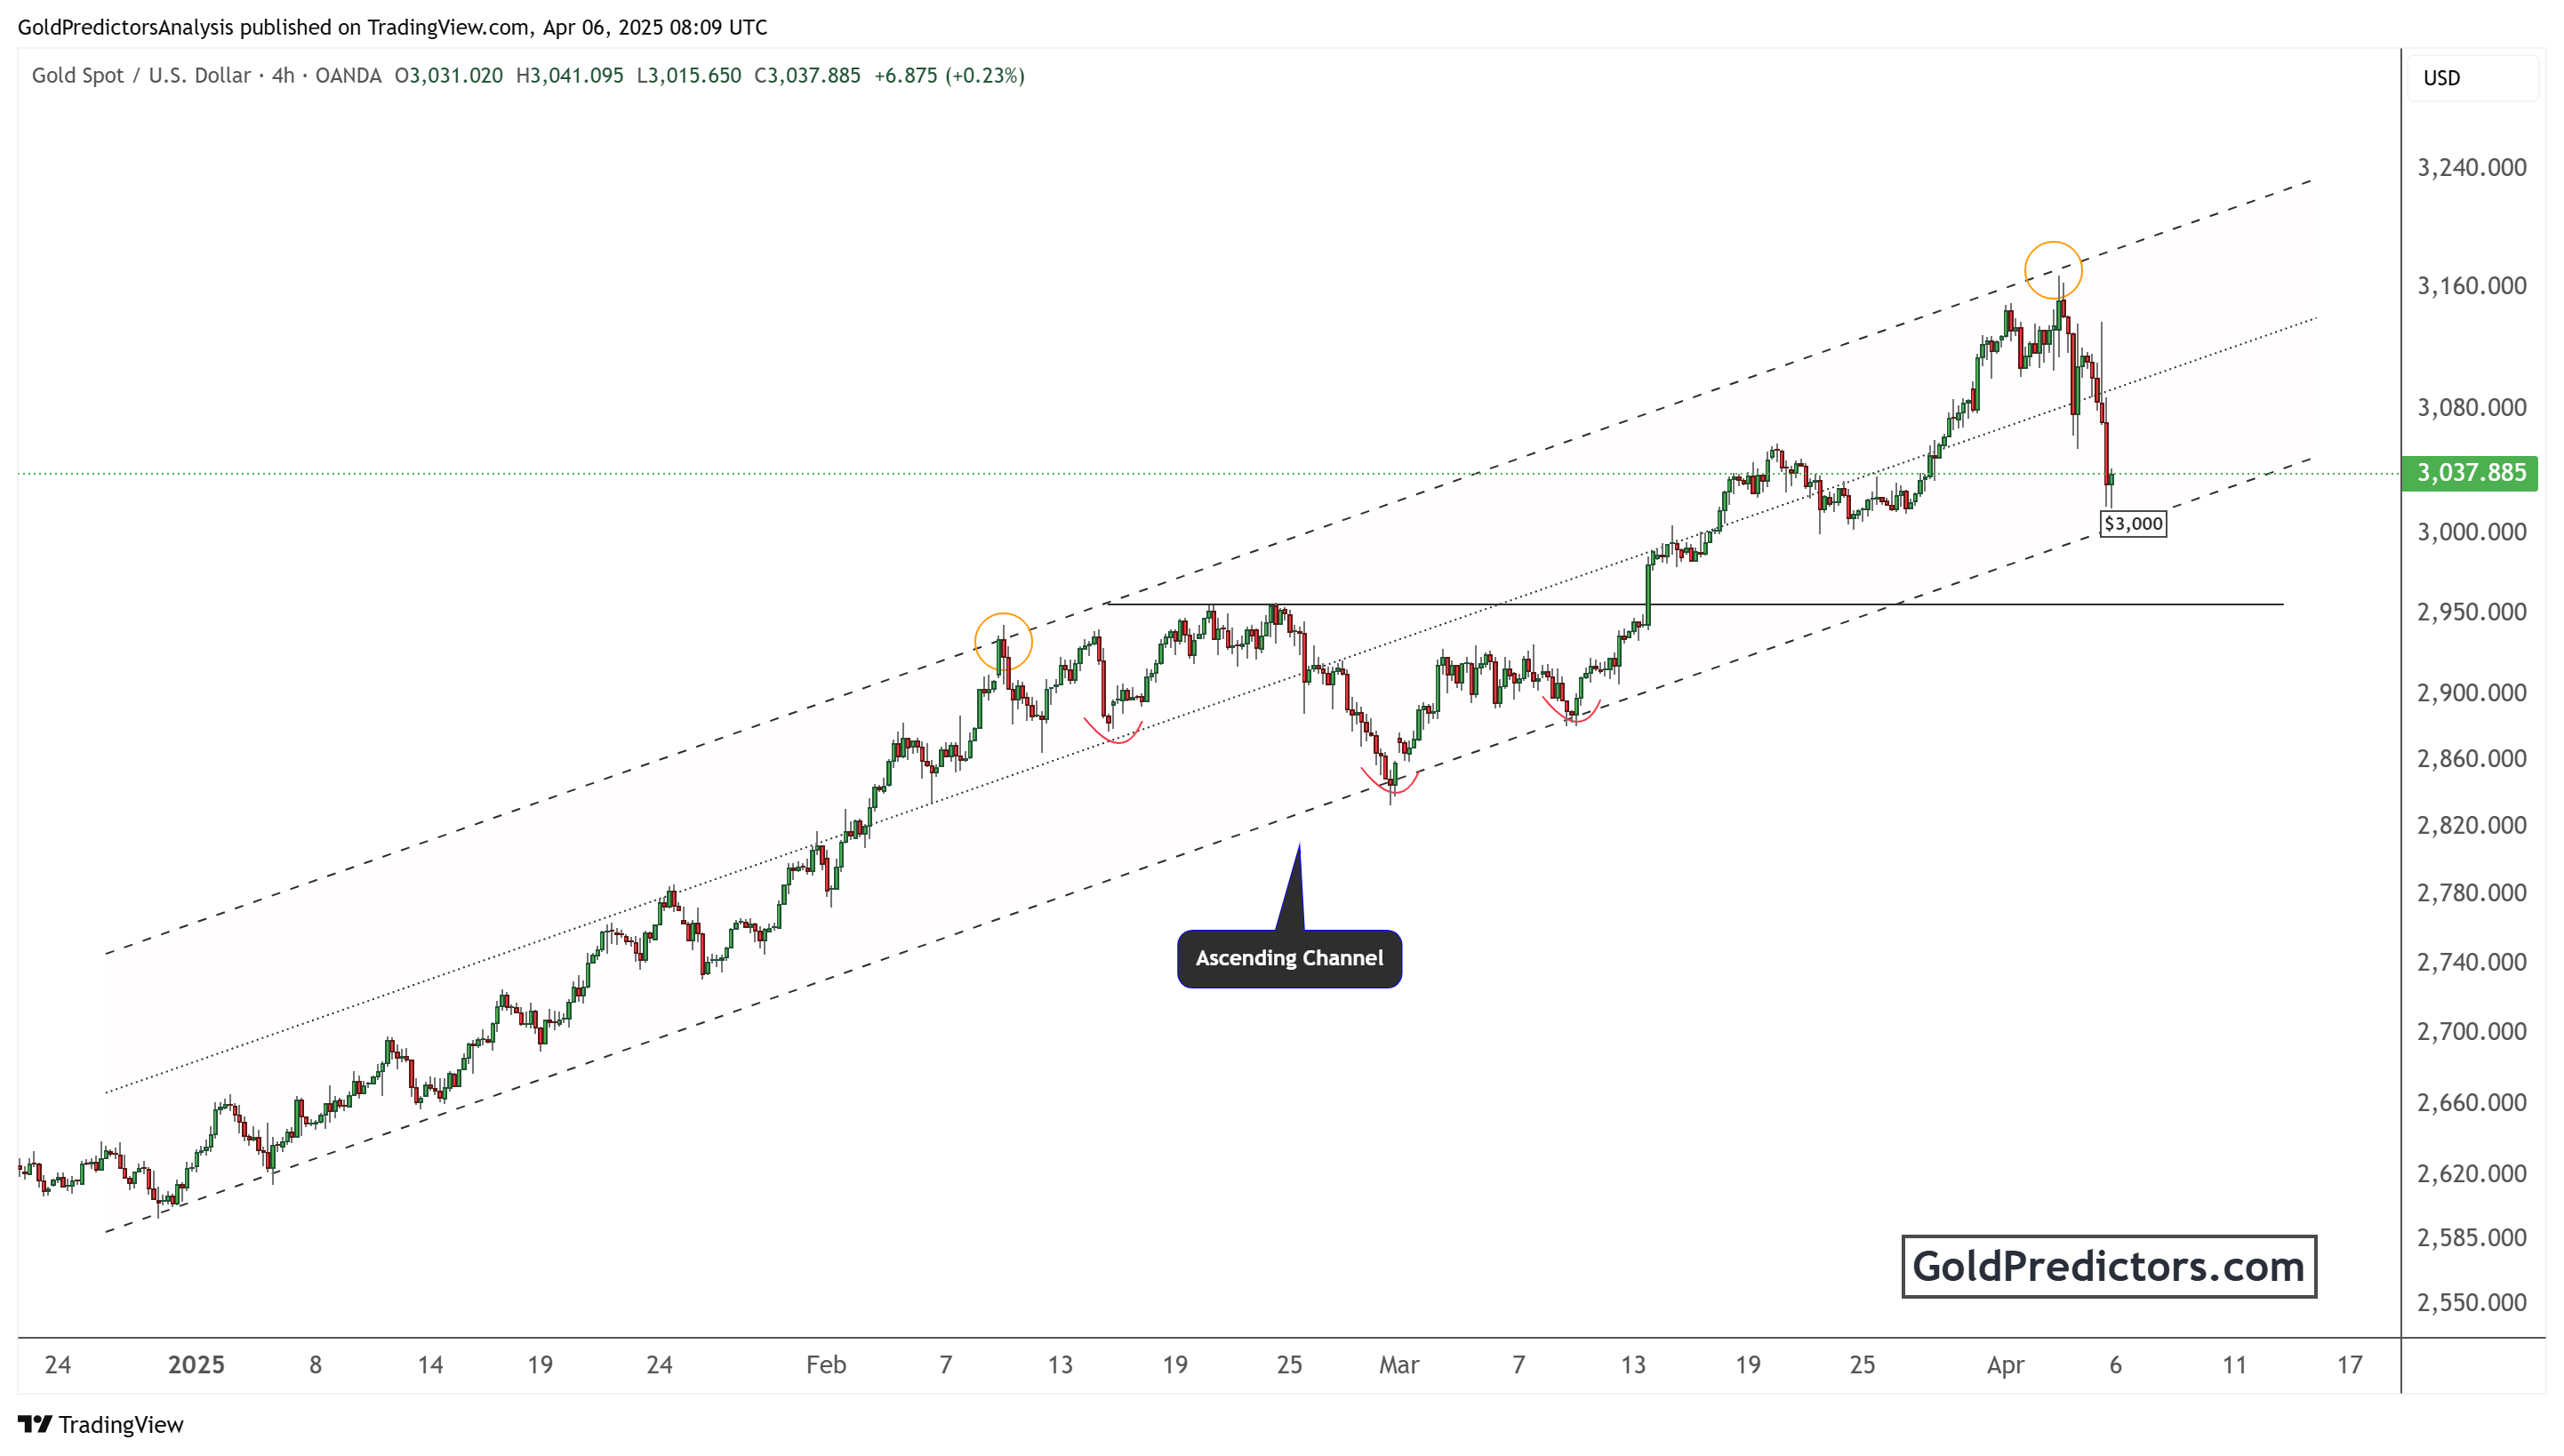
The chart highlights a series of higher highs and higher lows, which signal a strong bullish trend. In mid-February, gold tried to break above the channel but quickly reversed. This false breakout showed buyer exhaustion and led to a period of consolidation.
In late February and early March, gold formed an inverted head-and-shoulders pattern. The breakout from this pattern pushed prices back toward the channel’s upper resistance. By early April, gold touched the upper line again but faced rejection. A sharp drop followed, sending the price back near the lower channel support. The recent bounce from this support area suggests the channel remains intact. Although broader market fears persist, gold’s limited downside shows continued demand. Still, the failure to break higher reflects cautious sentiment among bulls.
Conclusion
Gold continues to move within a strong ascending channel, supported by central bank buying and global uncertainty. The price recently bounced from major support around $3,000, maintaining its bullish structure. However, repeated failures to break above the upper boundary of the channel reflect ongoing investor hesitation amid mixed signals. The technical picture supports more sideways to upward movement as long as the support level holds. Macroeconomic triggers will likely drive the next major move.
Unlock exclusive gold and silver trading signals and updates that most investors don’t see. Join our free newsletter now!
Unlock exclusive gold and silver trading signals and updates that most investors don’t see. Join our free newsletter now!
Author

Muhammad Umair, PhD
Gold Predictors
Muhammad Umair is a financial markets analyst and investor who focuses on the forex and precious metals markets.


