Gold: High time to move out of the penthouse

Gold’s days in a glamorous apartment at the top of the PMs’ building are numbered. We’d better prepare for a rapid elevator ride to the first floor.
The Gold miners
With the gold miners essentially running laps on the treadmill, the HUI Index, the GDX ETF, and the GDXJ ETF are working extremely hard but making little progress. And with the gambit resulting in ‘one step forward, two steps back,’ frustrating exhaustion has mining stocks questioning their every move. To that point, even though the trio transitioned from the conveyor belt to the stairs in recent weeks, history shows that slow climbs often culminate with elevator rides lower. Should we expect a different outcome this time around?
Gold ended the week in the green (up by $27.30), but the HUI Index was stuck in the red (down by 1.39). This is extremely noteworthy, as a similar divergence occurred at the end of May. For context, when the yellow metal rallied by $28.60 in a week back then, the HUI Index fell by 1.37 index points.
In the following weeks, the HUI Index declined by about 50 index points, while gold declined by about $150.
And with the ominous imbalance preceding the pair’s precipitous declines, again, should we expect a different outcome this time around?
To explain, with the HUI Index unable to muster any meaningful relief rallies, I warned that the recent plunge was weeks in the making:
I wrote the following about the week beginning on May 24:
What happened three weeks ago was that gold rallied by almost $30 ($28.60) and at the same time, the HUI – a flagship proxy for the gold stocks… Declined by 1.37. In other words, gold stocks completely ignored gold’s gains. That shows exceptional weakness on the weekly basis and is a very bearish sign for the following weeks.
To that point, with the HUI Index’s ominous signals only increasing, if history rhymes (as it tends to), medium-term support will likely materialize in the 100-to-150 range. For context, high-end 2020 support implies a move back to 150, while low-end 2015 support implies a move back to 100. And yes, it could really happen, even though such predictions seem unthinkable.
Furthermore, with the junior miners often suffering the most during medium-term drawdowns, short positions in the GDXJ ETF will likely offer the best risk-reward ratio. For context, if you held firm in 2008 and 2013 and maintained your short positions, you almost certainly realized substantial profits. And while there are instances when it’s wise to exit one’s short positions, the prospect of missing out on the forthcoming slide makes it quite risky.
Even more bearish, a drastic underperformance by the HUI Index also preceded the bloodbath in 2008. To explain, right before the huge slide in late September and early October, gold was still moving to new intraday highs; the HUI Index was ignoring that, and then it declined despite gold’s rally. However, it was also the case that the general stock market suffered materially. If stocks didn’t decline back then so profoundly, gold stocks’ underperformance relative to gold would have likely been present but more moderate.
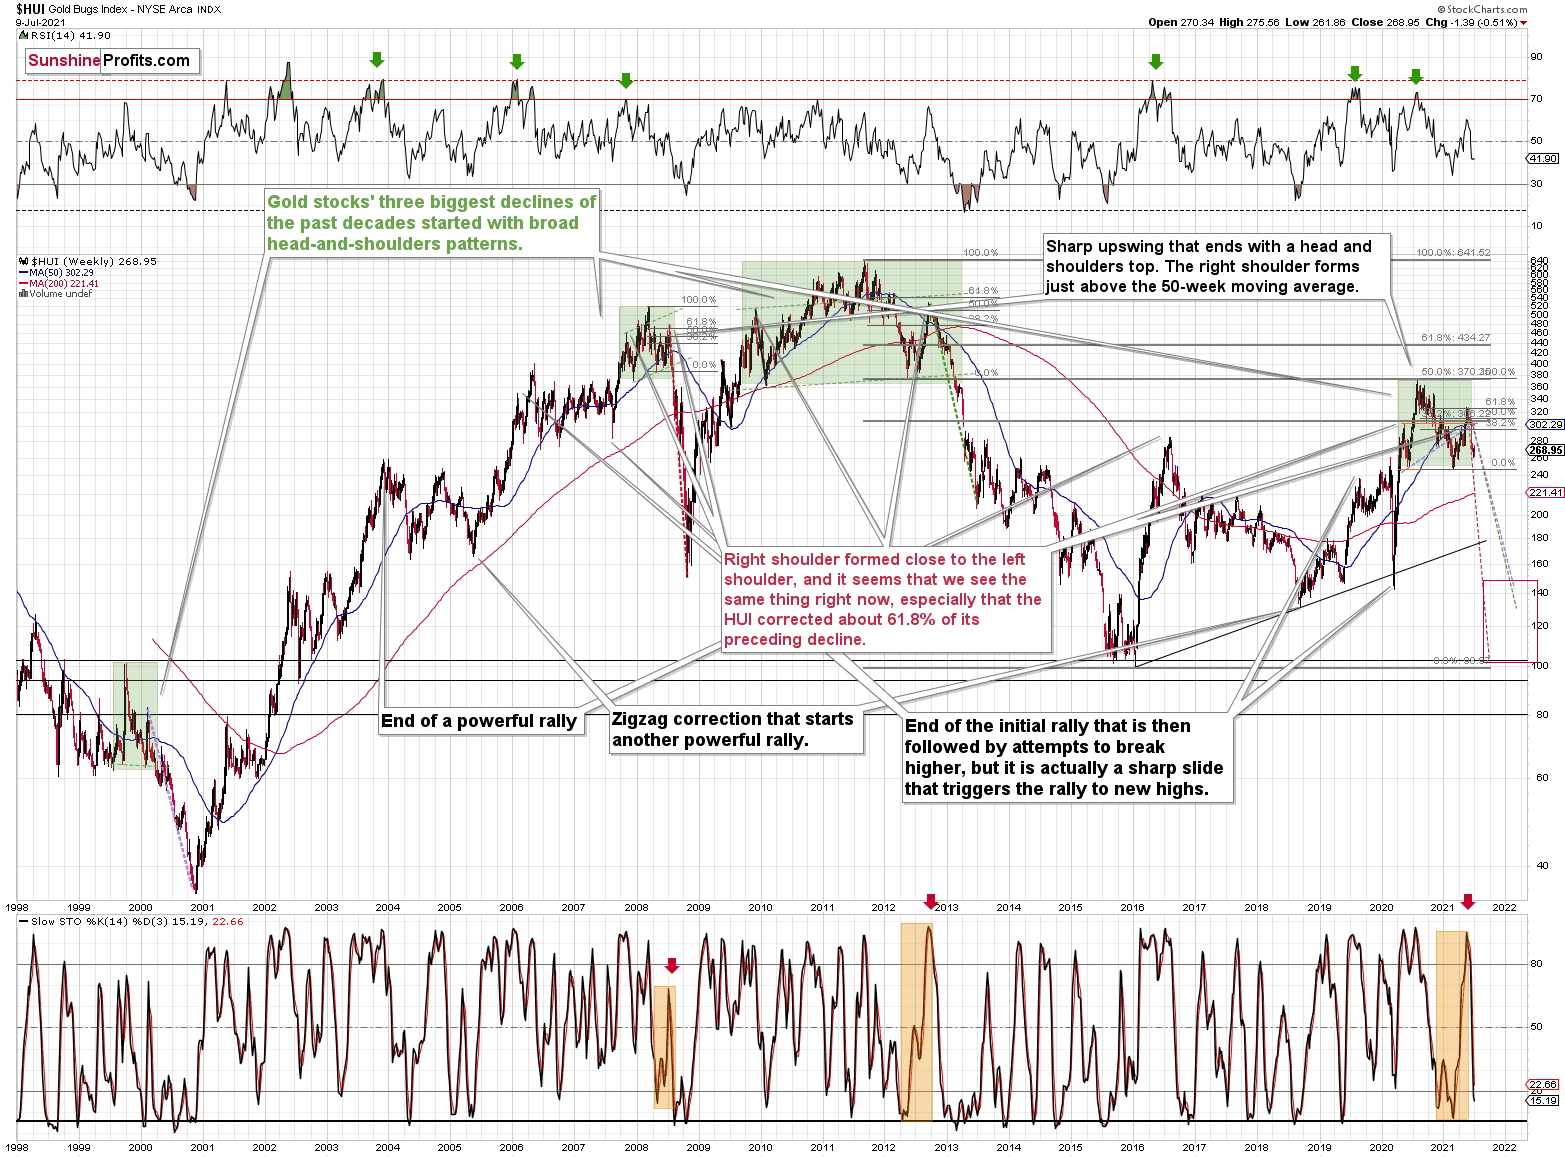
Nonetheless, the HUI Index’s bearish head-and-shoulders pattern is already sounding the alarm. When the HUI Index retraced a bit more than 61.8% of its downswing in 2008 and in between 50% and 61.8% of its downswing in 2012 before eventually rolling over, in both (2008 and 2012) cases, the final top – the right shoulder – formed close to the price where the left shoulder topped. And in early 2020, the left shoulder topped at 303.02. Thus, three of the biggest declines in the mining stocks (I’m using the HUI Index as a proxy here), all started with broad, multi-month head-and-shoulders patterns. And in all three cases, the size of the declines exceeded the size of the head of the pattern.
In addition, when the HUI Index peaked on Sep. 21, 2012, that was just the initial high in gold. At that time, the S&P 500 was moving back and forth with lower highs. And what was the eventual climax? Well, gold made a new high before peaking on Oct. 5. In conjunction, the S&P 500 almost (!) moved to new highs, and despite bullish tailwinds from both parties, the HUI Index didn’t reach new heights. The bottom line? The similarity to how the final counter-trend rally ended in 2012 (and to a smaller extent in 2008) remains uncanny.
As a result, we’re confronted with two bearish scenarios:
-
If things develop as they did in 2000 and 2012-2013, gold stocks are likely to bottom close to their early-2020 low.
-
If things develop like in 2008 (which might be the case, given the extremely high participation of the investment public in the stock market and other markets), gold stocks could re-test (or break slightly below) their 2016 low.
Keep in mind though: scenario #2 most likely requires equities to participate. In 2008 and 2020, sharp drawdowns in the HUI Index coincided with significant drawdowns of the S&P 500. However, with the Fed turning hawkish and investors extremely allergic to higher interest rates, the likelihood of a three-peat remains relatively high.
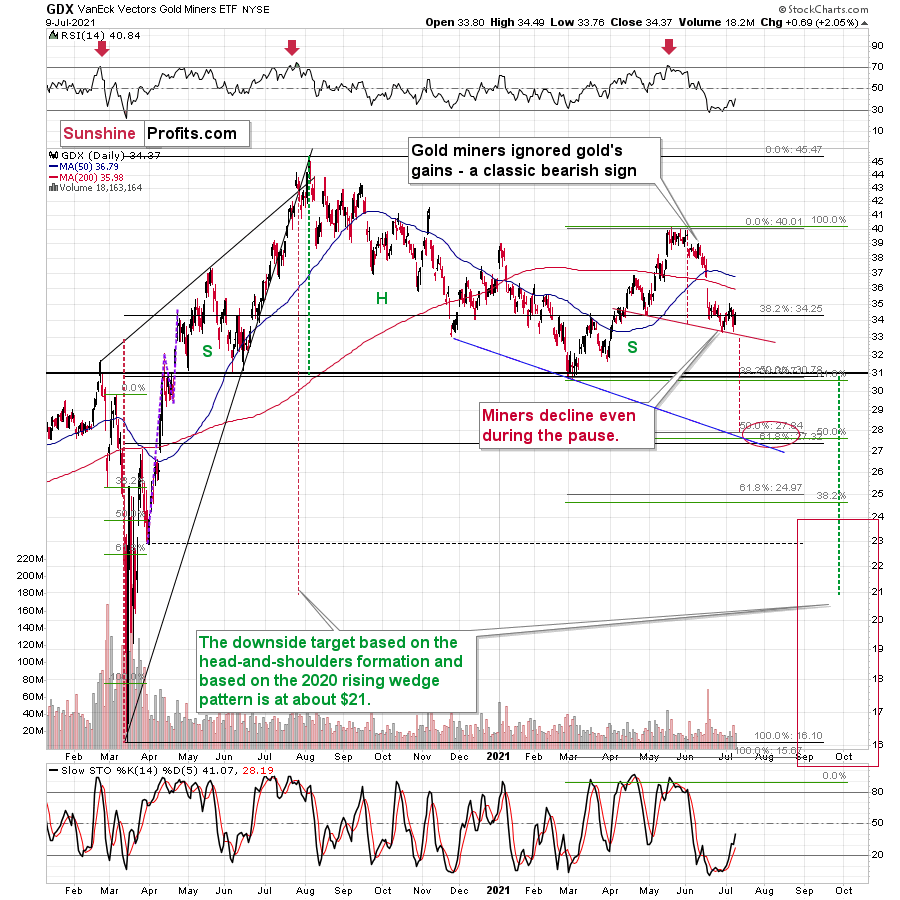
As further evidence, let’s analyze the behavior of the GDX ETF and the GDXJ ETF. Regarding the former, the senior miners celebrated gold’s strength by falling to their previous lows on Jul. 8. If this is not a shocking proof of extreme underperformance, then I don’t know what would be one.
Regarding the latter, on Jun. 29 (the June low), the GDXJ ETF closed at $45.83. And on Jul. 8, it closed at $45.53. Ladies and gentlemen, we had a breakdown.
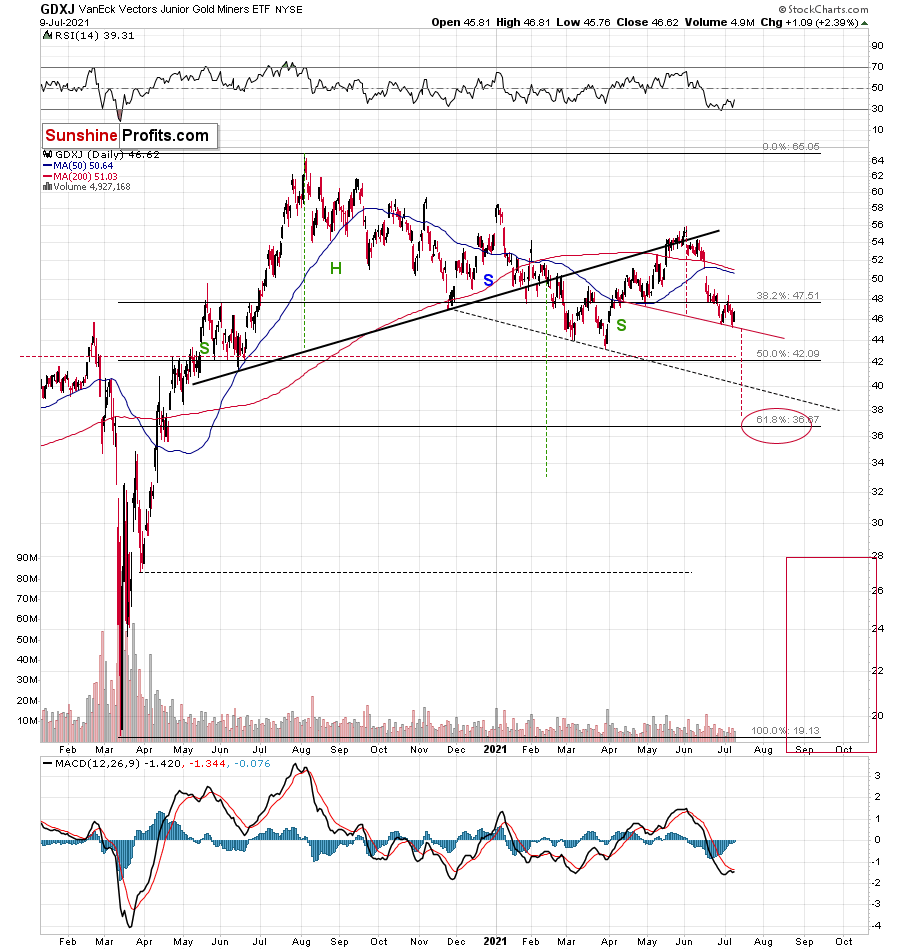
Of course, we see that the breakdown was invalidated, but the fact that it moved to new lows while gold rallied is extremely bearish. It seems like the junior miners simply can’t wait to break to new lows.
The bottom line?
If gold repeats its June slide, it will decline by about $150. Taking the entire decline into account (since August 2020), for every $1 that gold fell, on average, the GDX was down by about 4 cents (3.945 cents) and GDXJ was down by about 6.5 cents (6.504 cents).
This means that if gold was to fall by about $150 and miners declined just as they did so far in the past year (no special out- or underperformance), they would be likely to fall by $5.92 (GDX) and $9.76 (GDXJ). Given the Jul. 8 closing prices, this would imply price moves to $27.76 (GDX) and $35.78 (GDXJ). So, the profits on the current short position are likely to soar.
In conclusion, while the HUI Index, the GDX ETF and the GDXJ ETF are likely to have some small breathers along the way, their sprints lower are likely far from finished. When we combine their extreme underperformance relative to gold with the bearish 2008 and 2012 analogues, the gold miners might just huff and puff and blow their own houses down. As a result, while 2021 has already delivered two desperate pleas for more oxygen, the trio will likely require a third ventilator in the coming months. The outlook for the following weeks remains very bearish.
Want free follow-ups to the above article and details not available to 99%+ investors? Sign up to our free newsletter today!
Want free follow-ups to the above article and details not available to 99%+ investors? Sign up to our free newsletter today!
Author

Przemyslaw Radomski, CFA
Sunshine Profits
Przemyslaw Radomski, CFA (PR) is a precious metals investor and analyst who takes advantage of the emotionality on the markets, and invites you to do the same. His company, Sunshine Profits, publishes analytical software that any


