Gold has rebounded, but the bigger picture hasn't changed

The last time we covered gold, it was trading near $4,150. At the time, we argued that the technical picture looked rather weak and that we wouldn't have been surprised to see gold trading back toward the $3,000 area in the future. In the days that followed, selling pressure intensified, pushing gold as low as $3,942. It then stubbornly built a base around $3,960 between June 24 and July 1. Over the past few sessions, however, the metal has found enough strength to rally back, and as of today we're essentially back where we started at the beginning of June ($4,123 at the time of writing, although gold is down 0.98% on the session).
So, what happened in the meantime?
A handful of inflation releases came in slightly better than expected, particularly in the Eurozone and still-overheated Australia, but the more significant development has been the shift in approach by the world's major central banks. The move away from forward guidance—a policy strongly championed by the Fed's new Chair, Walsh—marks a major turning point, at least compared with the past 15 years. The shift was echoed last week by several of the world's leading central banks—including the ECB, BoE, and BoC—during the central banking forum in Sintra, Portugal.
At the same meeting, policymakers also reinforced their concern that inflation remains too high and must be brought under control despite the sharp decline in oil prices. This was already evident at the latest Fed meeting—which we'll revisit on Wednesday when the FOMC minutes are released—as the overall message was unmistakably hawkish.
You might expect US Treasury yields to have risen while long-term inflation expectations—the so-called 10-year breakeven inflation rate—also increased. But that's not what happened.
The US 10-year Treasury yield is only about 4 basis points higher than it was on June 17, while the 2-year yield is actually 3 basis points lower, currently at 4.135%. What has really collapsed is the 10-year breakeven inflation rate, which has fallen from 2.50% in mid-May to 2.24% yesterday. The result is that long-term real yields—arguably the macro variable with the strongest inverse correlation to gold prices—have continued to move higher, albeit gradually, and now stand around 2.26%, close to the upper end of their three-year range. That is still far from being supportive for gold.
Technical analysis
So why is gold rebounding? We continue to view the move as nothing more than a technical bounce.
On the 4-hour chart, the RSI has been displaying a bullish divergence since June 10, when gold was still trading near the key $4,360 pivot. That divergence paved the way for the consolidation around $3,960 in the second half of June. Gold had become heavily oversold, even on a relatively long intraday timeframe such as the 4-hour chart.
Chart caption Gold, four-hour, 2026
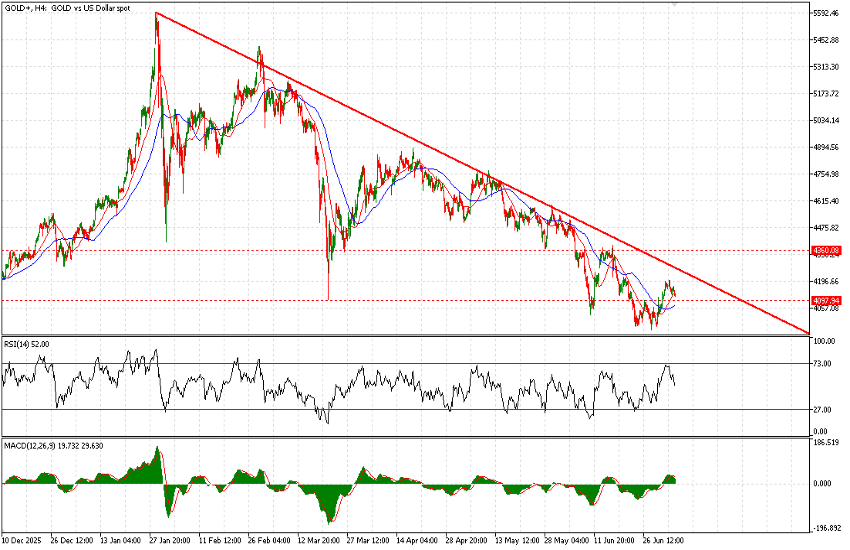
That said, the descending trendline continues to cap price action. As of today, it comes in around $4,260. Only a sustained move above that level would make us cautiously constructive on the metal again.
Moreover, on the daily timeframe, while the 21-day moving average sits around $4,146—roughly current levels—the 50-day moving average stands much higher at $4,381. Even if gold were to break above the descending trendline, it would still have to contend with both the 50-day moving average and the major $4,360 pivot level.
In short, we continue to believe that rallies remain selling opportunities, and we will only reconsider our view if the market breaks above the technical levels mentioned above.
Meanwhile, the daily RSI has recovered to 45. While still on the bearish side, it is no longer in oversold territory, leaving room for further downside—after all, it's difficult to advocate aggressive selling when momentum is already deeply oversold.
Although we are not including a longer-term chart here, we're also prepared to outline a medium-to-long-term downside target in the $3,300-$3,600 range. We'll have the opportunity to explain the reasoning behind that view in the coming weeks.
Author

Marco Turatti
Independent Analyst
More than 10 years of experience in institutional trading, several years in retail brokerage as a Market Analyst and Head of Dealing.