Gold Forecast: Primed for a bullish move, call option OI spikes

Gold (XAU/USD) jumped 0.75 percent to $1282.96 on Monday on the back of a broad based USD sell-off.
As of writing, the yellow metal is trading at $1275 levels; down 0.40 percent on the day. Despite Monday's rally, the metal remains restricted to a range defined by $1281 (50% Fib R of Jul/Sep rally) and $1263.09 (61.8% Fib R of Jul/Sep rally).
The decline from the yesterday's high of $1282.96 to $1275 could be attributed to 0.37% gains seen in the USD index. So will the failure to hold above $1280 yield a downside break of the trading range of $1281-$1263.09?
The options data indicates the investors are betting on the bullish break of the trading range.
The data published by the CME shows a big jump in the open interest (OI)/open positions in the November expiry call options (bullish bets).
Gold OGZ7 Open Interest Change: Current (Nov 6 - Prelim) vs. Nov 3
| Call Summary | |||||
| Total | ITM | OTM | |||
| OI | Chg | OI | Chg | OI | Chg |
| 275,403 | 4,943 | 32,251 | 307 | 243,152 | 4,636 |
| Put Summary | |||||
| Total | ITM | OTM | |||
| OI | Chg | OI | Chg | OI | Chg |
| 171,426 | -851 | 22,260 | -120 | 149,166 | -731 |
- The open positions in the call options jumped by 4943 contracts on Monday. On the other hand, open positions in the put options dropped by 851 contracts.
- The changes in open positions clearly highlight the bullish bias.
- Moreover, the drop in the open interest in put options validates to the argument that the metal is poised for an upside break. This is because it indicates that investors are not only boosting bullish bets, but also squaring off bearish bets (put options). Thus, a potential move higher in the yellow metal is likely to last at least for a couple of weeks.
The technical studies seem to agree with the bullish options data.
Daily chart- Bullish continuation pattern
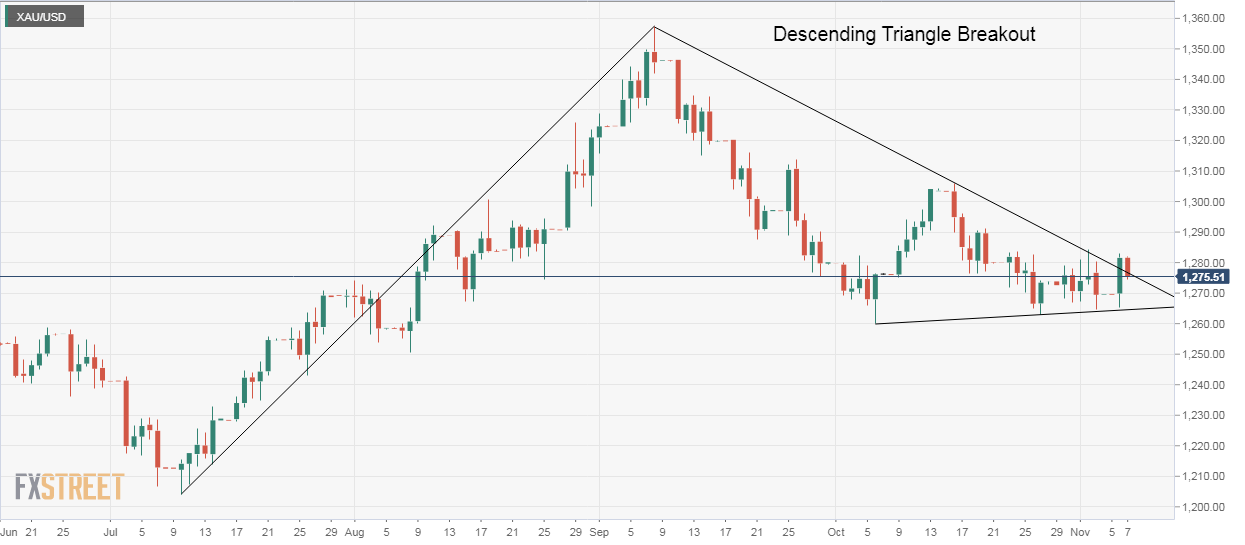
The above chart shows-
- Descending triangle breakout - It is a bullish continuation pattern, i.e. the rally from the Jul. 10 low of $1204.20 has resumed.
View
- The metal looks set to explore upside up to $1306 (Oct. 16 high) in the short-run. A violation there would expose the Sep. 8 high of $1357.50.
- On the downside, only an end of the day close below $1264.60 (descending triangle support) would revive the sell-off from the high of $1357.50.
Author

Omkar Godbole
FXStreet Contributor
Omkar Godbole, editor and analyst, joined FXStreet after four years as a research analyst at several Indian brokerage companies.


