Gold Forecast: Bullish reversal confirmed

The post-FOMC sell-off in the US dollar pushed gold (XAU/USD) to a high of $1257. The yellow metal extended gains further to $1259 levels today before falling back to $1254 levels.
What's next?
The charts point to short-term bullish reversal confirmation, but also indicates the metal would crowd out weak hands (weak bulls) by trading in the sideways manner before rallying to $1275 (61.8% Fib R of recent sell-off).
Daily chart
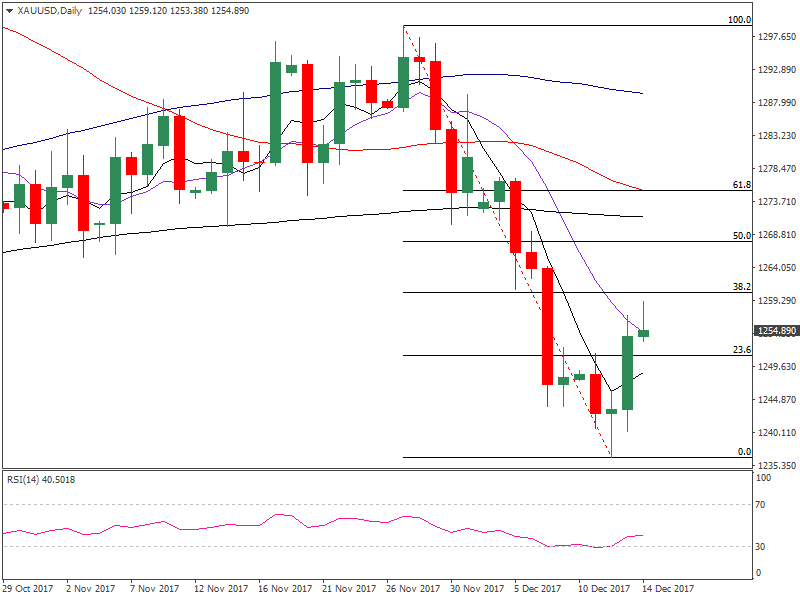
Yesterday's move higher marked confirmation of a bullish doji reversal. It indicates the sell-off from the high of $1300 has made a low at $1236.50.
Still the job is half done as-
- The 10-day MA is sloping downwards. Today's retreat from $1259 to $1254, i.e. failure to hold above 10-day MA only adds credence to the argument that a consolidation is likely in the next 2-3 days and allow for bottoming out of the 10-day MA.
- Also, the metal is yet to take out the descending trendline seen on the on the 4-hour chart below.
4-hour chart

- Only a 4-hour close above the falling trendline would add credence to the bullish doji reversal and shall open doors for a sustained move higher to $1275 levels.
- The trend line hurdle is seen sloping downwards to $1258 levels over the next few days.
View
- A short-term consolidation around $1250 could be in the offing.
- The upside move is seen gathering pace after the 10-day MA has bottomed out. The immediate upside target is $1275. A violation there would open up upside towards $1290.
- On the downside, only a daily close below $1236.50 (Dec. 12 doji candle low) would revive the bearish move.
Author

FXStreet Team
FXStreet
More from FXStreet Team


