Gold fights for its long-term trend. Palladium's next target may surprise you


Well, November has opened with quite an interesting contrast.
Just a few days ago, sellers were pushing gold and palladium through important technical barriers, leaving buyers with increasingly uncomfortable decisions. However, the completed October candles - and Monday's first reactions - are telling us something worth exploring.
What if two markets facing significant bearish pressure are approaching their next decisions for entirely different reasons?
Gold has arrived at a support combination involving a rising trendline that has accompanied its longer-term advance for years.
And buyers are fighting back.
Palladium, meanwhile, has confirmed a monthly consolidation breakdown, revealing a downside projection that almost perfectly matches a Fibonacci level we identified in last week's Lab.
One market is trying to defend the technical foundation of its larger trend. The other may be facing another important bearish destination. Yet both are showing why a price target or support level is never the entire story.
What matters is how buyers and sellers respond when they get there.
Let's take a closer look.
A quick note on our futures charts: some previously discussed price gaps now appear with slightly different boundaries. Such changes may reflect futures-series adjustments or historical data revisions. We use the levels displayed on our current charts in today's analysis. As always, please verify them against the instrument and data feed you trade.
Gold (GC.F) - The bulls finally fight back. Can they save the bigger trend?
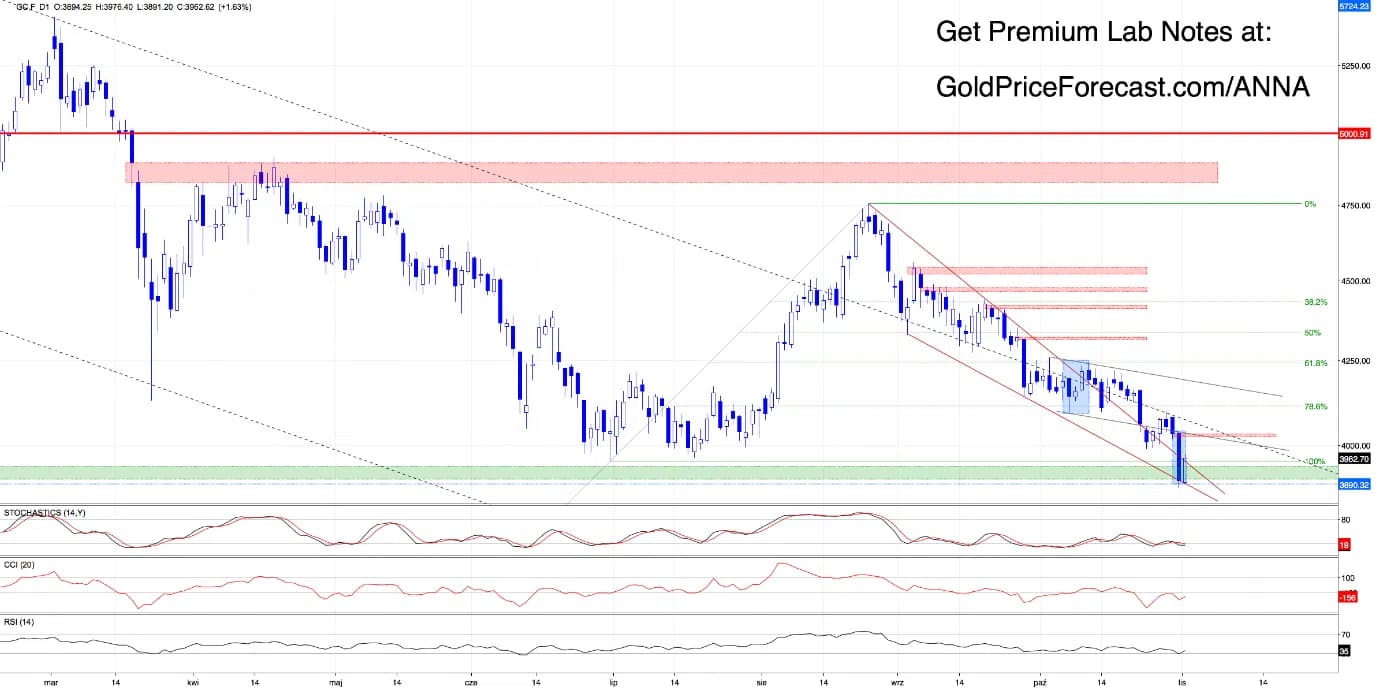
Do you remember the technical battlefield we highlighted on Friday?
The one where the lower boundary of a falling wedge, a multiyear rising trendline, and historical support near 3890 were coming together?
Well, gold has just given us a particularly interesting response.
In Friday's Free Lab Note, we explained how the decline had fulfilled the measured downside projection of the black declining channel and brought prices toward the long-term support combination.
Now buyers are fighting back from that very neighborhood and they're not doing it quietly.
Monday's low near 3891 was followed by a recovery above the June low around 3955 and an intraday return above the upper boundary of the red falling wedge.
That's encouraging, especially after last week's relentless selling, but… yes, here's the catch.
Defending long-term support is one thing, but repairing the technical damage already done is another.
And the monthly chart makes that distinction particularly important.
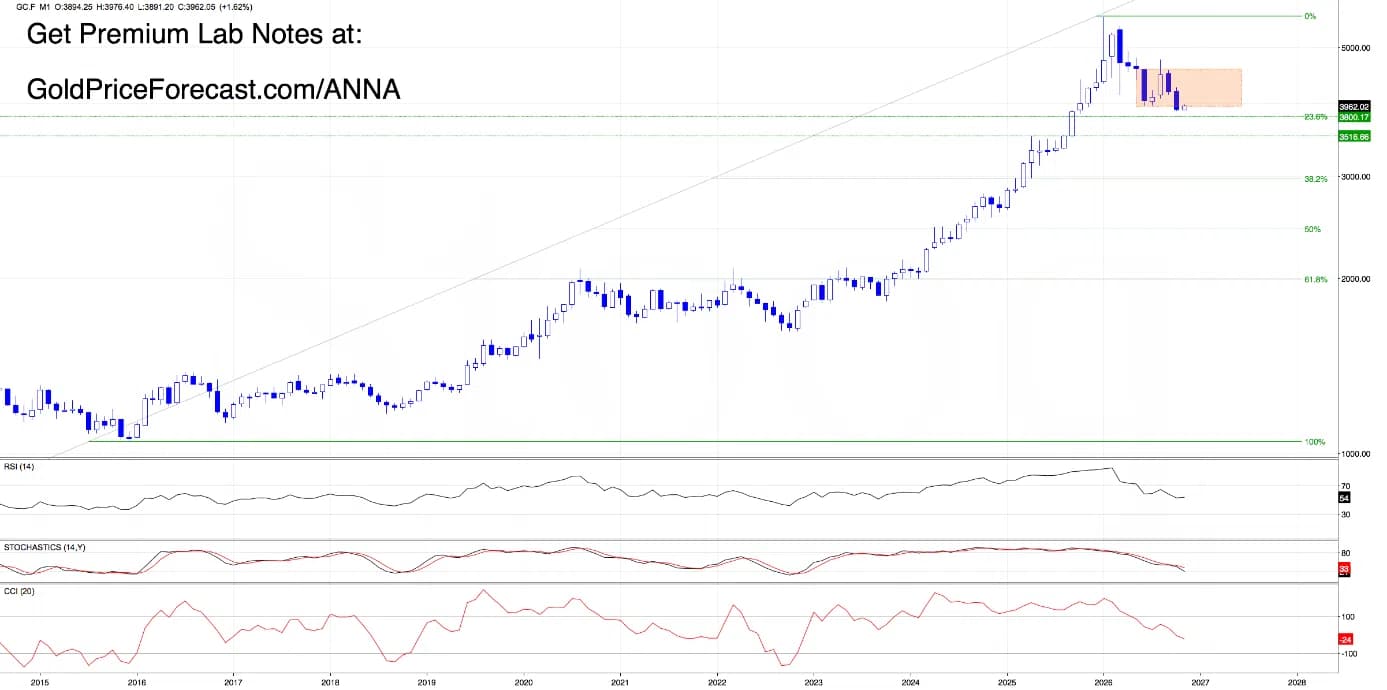
October closed below 3955, the lower boundary of the orange consolidation extending toward 4577. That confirmed a monthly breakdown.
From today’s point of view, we see November's buyers have already returned above 3955 intraday, but invalidating the monthly signal would require the completed November candle to close back above that boundary and we won't know that until November 30.
The weekly chart offers another reason to pay attention.
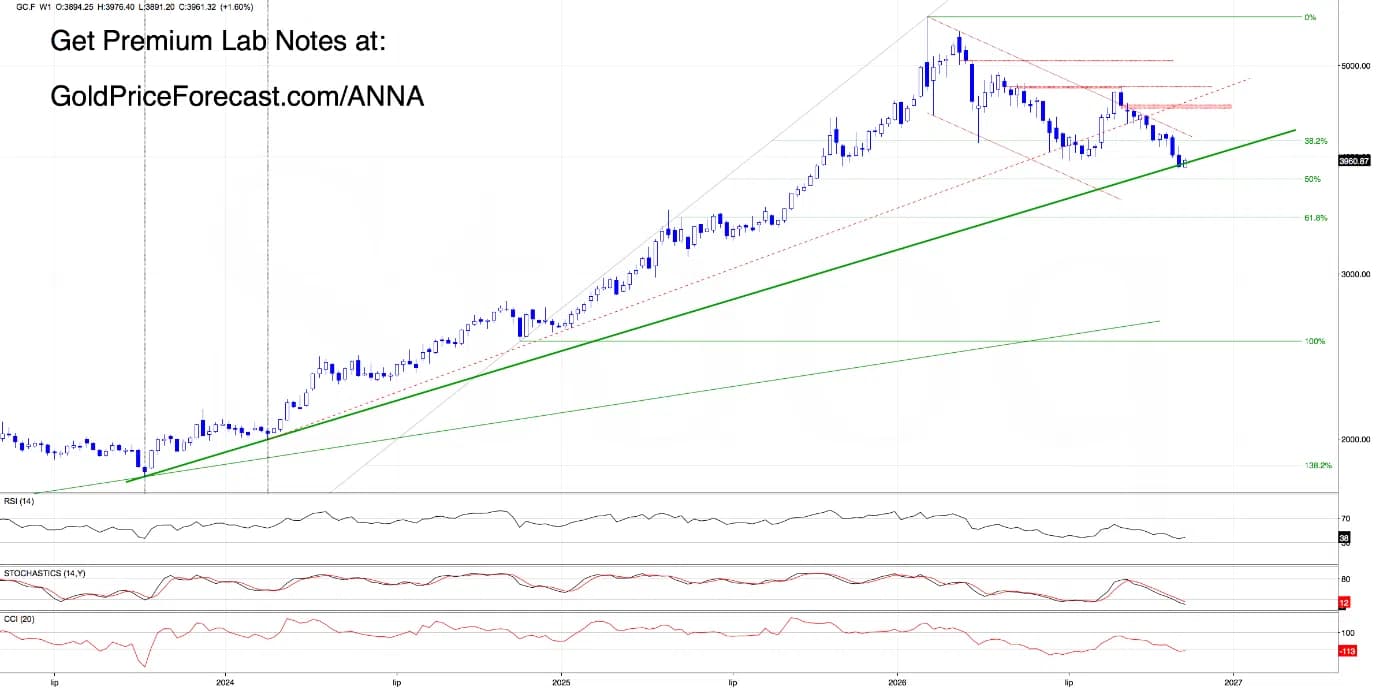
Friday's close occurred near the multiyear green rising trendline, and Monday's buyers have returned above it after initially trading below. The line currently runs around 3930, making it an important reference throughout the week.
A weekly close above that dynamic support would strengthen the argument that the long-term defense is succeeding.
But let's return to the daily chart, because there's another obstacle waiting overhead.
The lower boundary of the black declining channel
Thursday's close below that boundary gave sellers another technical advantage. The present rebound raises a question: are buyers preparing to invalidate that breakdown, or are they simply testing the broken boundary from below?
A daily close back above the channel would strengthen the recovery scenario. From there, the previously lost weekly-gap area at 4098-4135 and the former orange consolidation boundary near 4156 could become relevant again.
However, rejection beneath the black channel would leave the rebound vulnerable.
Another failure around 3890, followed by confirmed breakdowns of the broader support combination, would revive the bearish scenario discussed in Friday's Lab, including the 3761-3785 downside area.
The monthly 23.6% Fibonacci retracement near 3800.17 provides an additional reference between the current battlefield and those deeper targets.
For now, though, the bulls have accomplished something worth watching.
They have responded precisely where the bears' earlier roadmap suggested an important battle might begin.
Whether they can turn that response into a lasting recovery is the next question.
Daily takeaways: Gold is defending the 3890 support combination and has recovered 3955 and the red wedge's upper boundary intraday. The black declining channel remains the next important resistance. A weekly close above the long-term rising trendline near 3930 would strengthen the defense, while a confirmed monthly recovery above 3955 requires November's closing candle.
Palladium (PA.F) - October's breakdown reveals a bigger downside target
Palladium has been delivering one bearish objective after another and after examining the completed October candle, we're beginning to understand why the sellers have been so persistent.
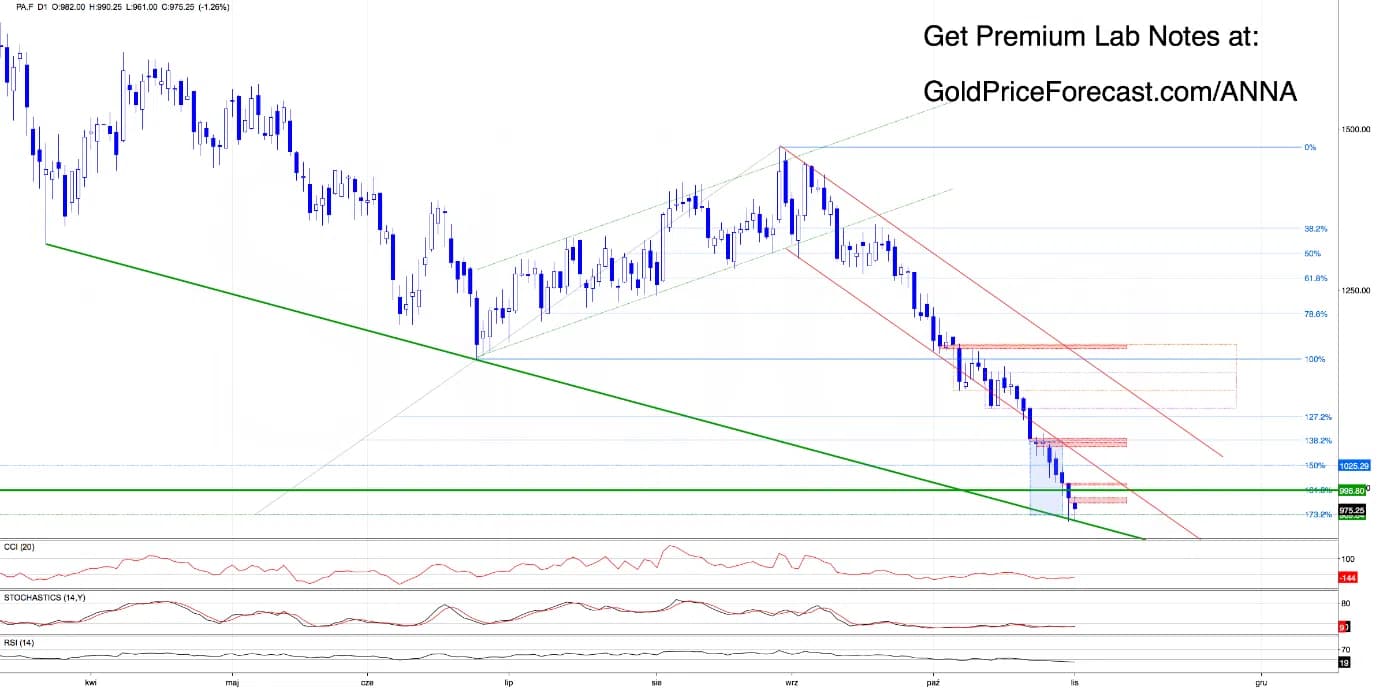
Remember how the market moved through our earlier Fibonacci objectives, lost 1000, and eventually reached the green descending support line around 970?
We followed that sequence through last week's Labs, but the monthly chart now adds another important piece to the puzzle.
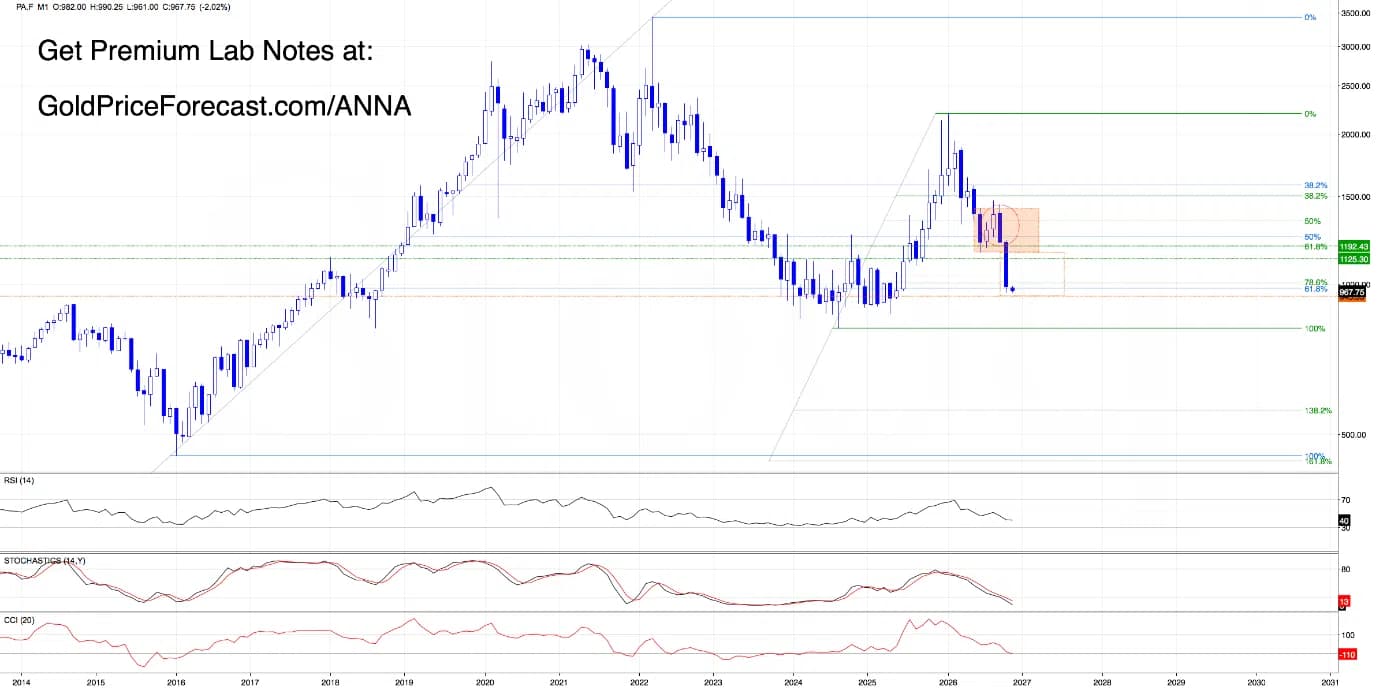
October confirmed a breakdown below the orange consolidation at 1156-1420.
The decline also carried prices through important monthly Fibonacci support levels and below the psychological 1000 barrier.
And November?
It opened with another bearish gap at 982-987.70.
Not exactly the welcome palladium bulls were hoping for, but here's where things become particularly interesting.
The monthly consolidation measured 264 points in height, from 1156 to 1420.
Projecting that distance downward from the broken lower boundary gives us a measured downside objective near 892.
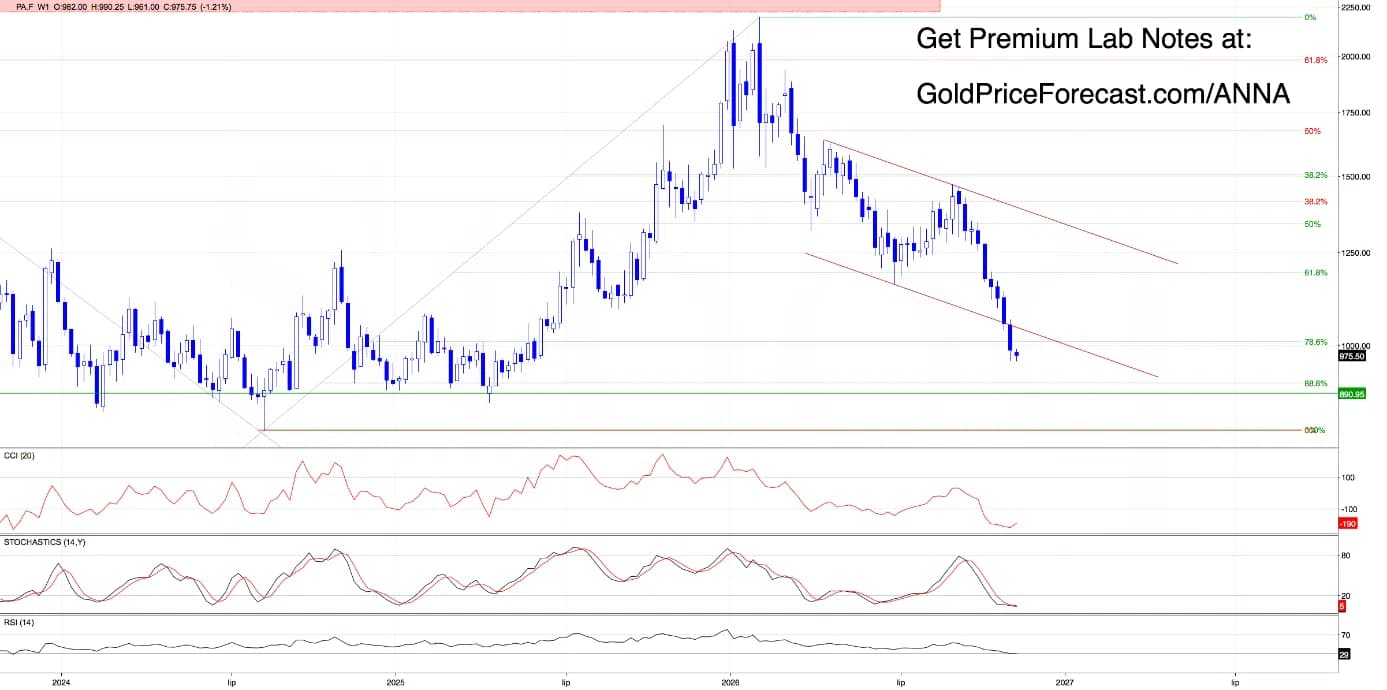
Now compare that projection with the weekly 88.6% Fibonacci retracement at 890.95, which we highlighted in Friday's Premium Lab Note #247. Two independent technical measurements point toward virtually the same destination, which makes the 891-892 neighborhood a particularly interesting conditional downside objective.
But are sellers ready to head there immediately?
Not so fast.
Monday has brought another test of the green descending support line, currently around 963.50. After dipping to 961, buyers managed to recover above that line intraday and that defense matters.
As long as sellers fail to secure a daily close below the dynamic support, the bulls retain an opportunity to attempt a corrective rebound.
However, the obstacles overhead are substantial.
First comes the fresh 982-987.70 bearish gap. A daily close above 987.70 would confirm its closure and improve the immediate picture. Then buyers must reclaim 1000 and beyond that lies the previously broken lower boundary of the red declining channel.
Until those barriers are recovered, we have little reason to assume that the broader bearish trend has ended.
In fact, a confirmed daily breakdown beneath the green support line would strengthen the possibility that the market is preparing another decline toward the newly identified 891-892 confluence.
With the weekly Stochastic and RSI already deeply oversold, a sharp defensive rebound remains possible, but we've seen enough failed palladium recoveries lately to know that oversold conditions alone don't make a bullish case.
Daily takeaways: the fresh bearish gap at 982-987.70 and psychological 1000 level remain immediate resistance. The green descending support line near 963.50 is the crucial short-term defense. A confirmed breakdown would bring the monthly measured objective near 892 and weekly 88.6% Fibonacci retracement at 890.95 into focus.
What about the other four markets?
The stories unfolding in gold and palladium are only part of November's opening chapter.
The U.S. dollar is approaching an intriguing technical crossroads. After repeated failures at resistance, Monday's decline has brought prices almost exactly back to their October 22 low. Could buyers be attempting to develop a double bottom?
Silver has a different problem. Friday confirmed a weekly breakdown beneath the red triangle, but buyers have already returned above its lower boundary intraday. Will that recovery survive the weekly closing test?
Platinum is struggling to repair the damage caused by October's confirmed monthly consolidation breakdown. Monday's rebound has recovered a Fibonacci level, but the larger resistance barriers remain intact.
And copper?
After two consecutive weekly closes beneath its rising wedge, buyers are attempting another comeback. But an important combination of bearish-gap resistance and broken trendline support is waiting overhead.
These developments raise an uncomfortable question: which of the current recoveries could actually change the technical outlook - and which are merely testing the structures that sellers recently broke?
Final thought - The first rebound doesn't rewrite the last breakdown
There's something revealing about the first trading session of a new month.
After weeks of selling pressure, buyers suddenly appear at important support levels and make the market look a little more hopeful. Sometimes those reactions become the beginning of meaningful recoveries. Other times, they simply give the bears another opportunity to defend broken support from above.
That's why today's rebounds are interesting - but not yet convincing.
The most useful question isn't whether the bulls have finally returned.
It's whether they can recover enough technical ground to make us reconsider the evidence that favored the bears in the first place.
November has opened the door to several intriguing possibilities. Now the market has to show us which ones deserve to stay open.
Author