|premium|

Gold, Chart of the Week: XAU/USD thrown to the bears at the edge of the abyss

  • Gold is pressured below critical multi-timeframe structures.
  • The following is an MTF frame analysis of the gold price. 

The gold price remains well embedded below its 200-week moving average due to the expectations that the US central bank will keep on raising rates at historically large clips in the face of strong inflationary headwinds. Closing at its lowest in more than two years on Friday as the dollar rose to a two-decade high following the Federal Reserve's latest hike to US interest rates last week, gold could be at a point of no return, at least for the immediate future should the USD and rates continue to move higher keeping pressure on the precious metals complex.

''We see the potential for continued outflows from money managers and ETF holdings to weigh on prices moving forward, which ultimately raises the probability of a pending capitulation from the small number of family offices and proprietary trading shops that hold complacent length in gold,'' the analysts at TD Securities argued. 

''In this context, while prices are certainly weak, precious metals' price action could still have further to fall as the restrictive rates regime is set to last for longer.''

Let's move to the technical landscape:

Gold monthly chart

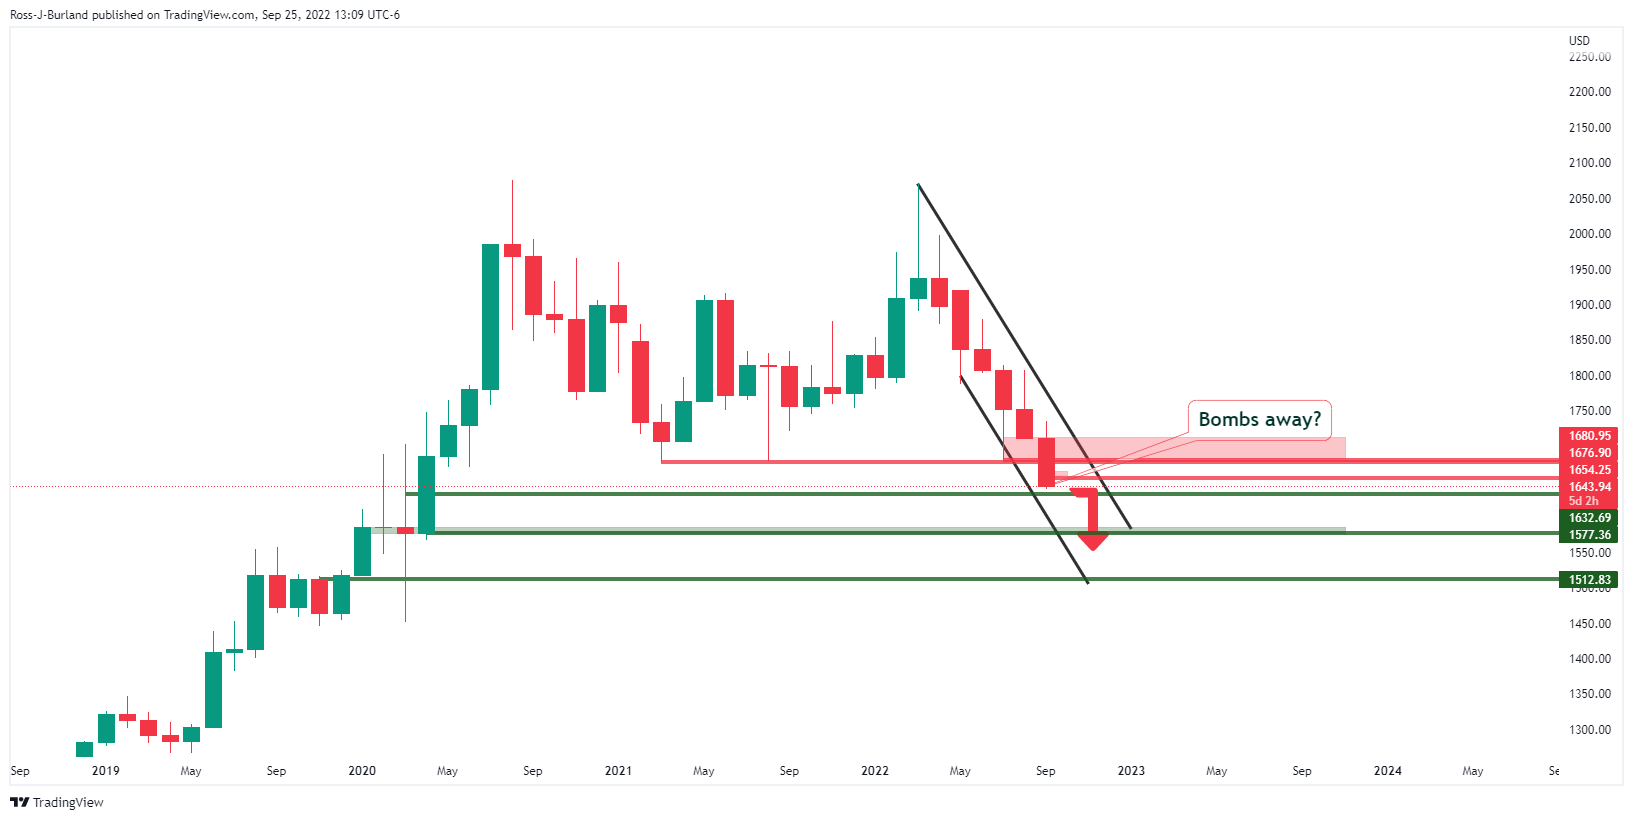
The price is extending lower and lower on a monthly basis and has just taken out some critical levels on the lower time frames as well as the monthly structures. A break of $1,577 opens risk to $1,512.

Gold weekly chart

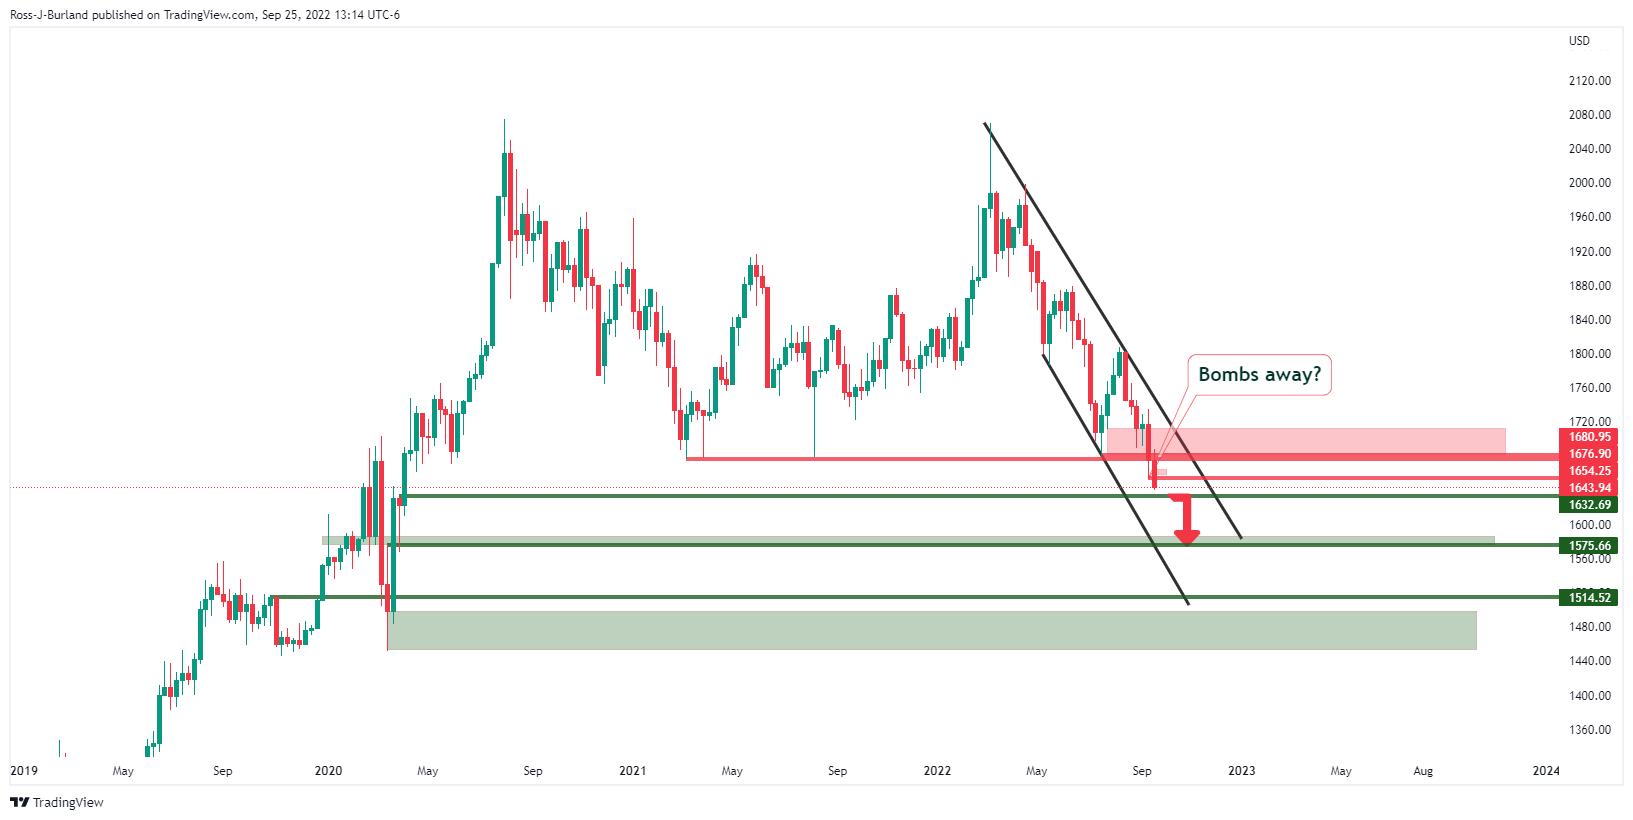
We have a similar scenario on the weekly chart towards the support of $1,632 following a break of key structure.

Gold daily and H1 charts

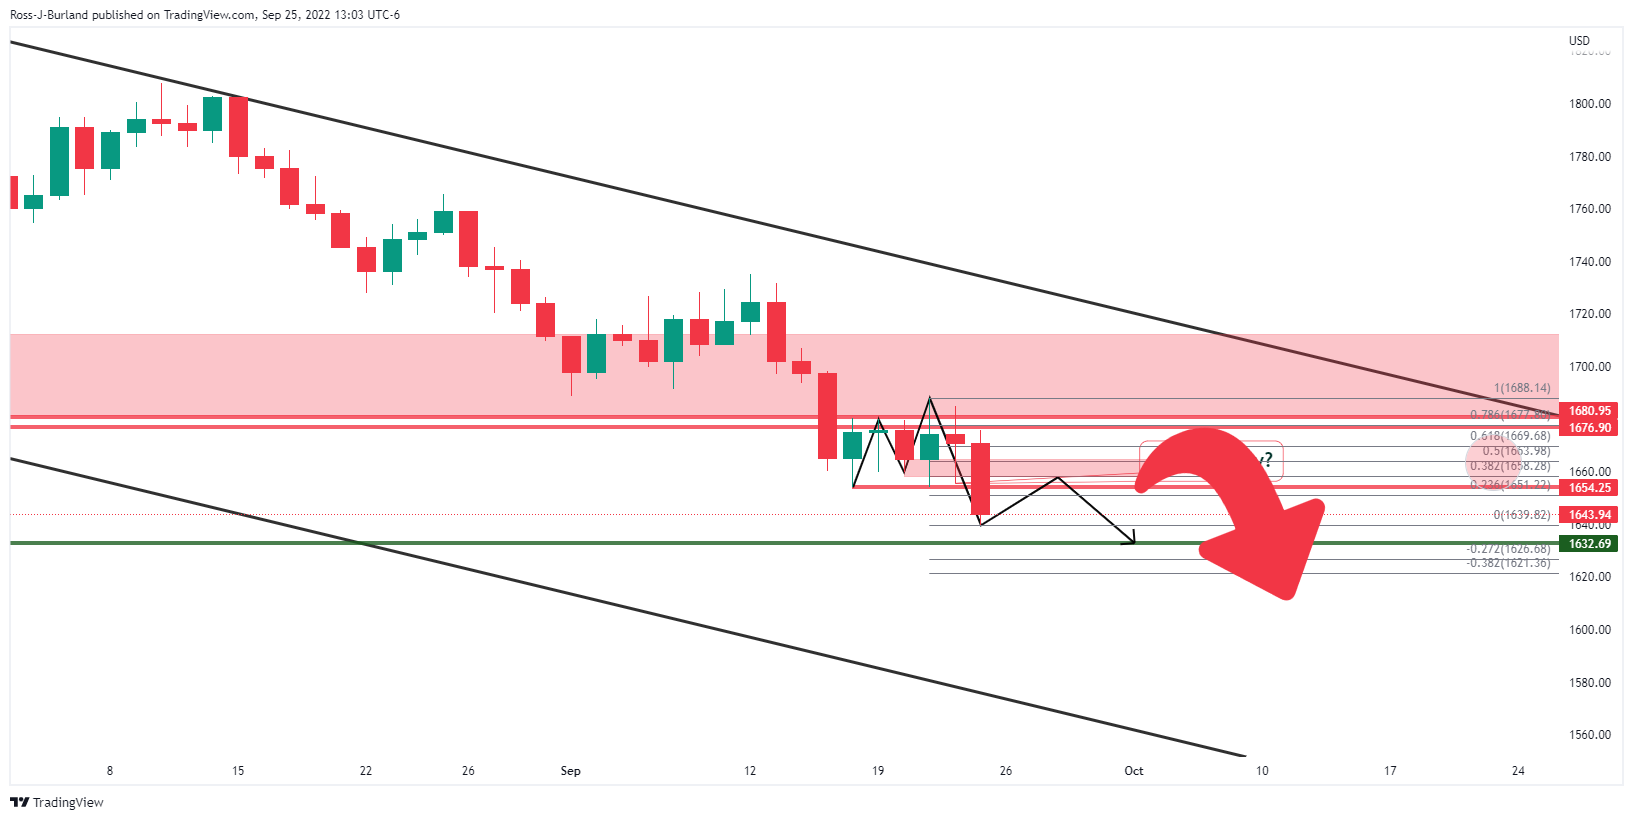
The daily chart is a little more clouded with the M-formation, a reversion pattern that could pull in the price prior to the next move to the downside. 

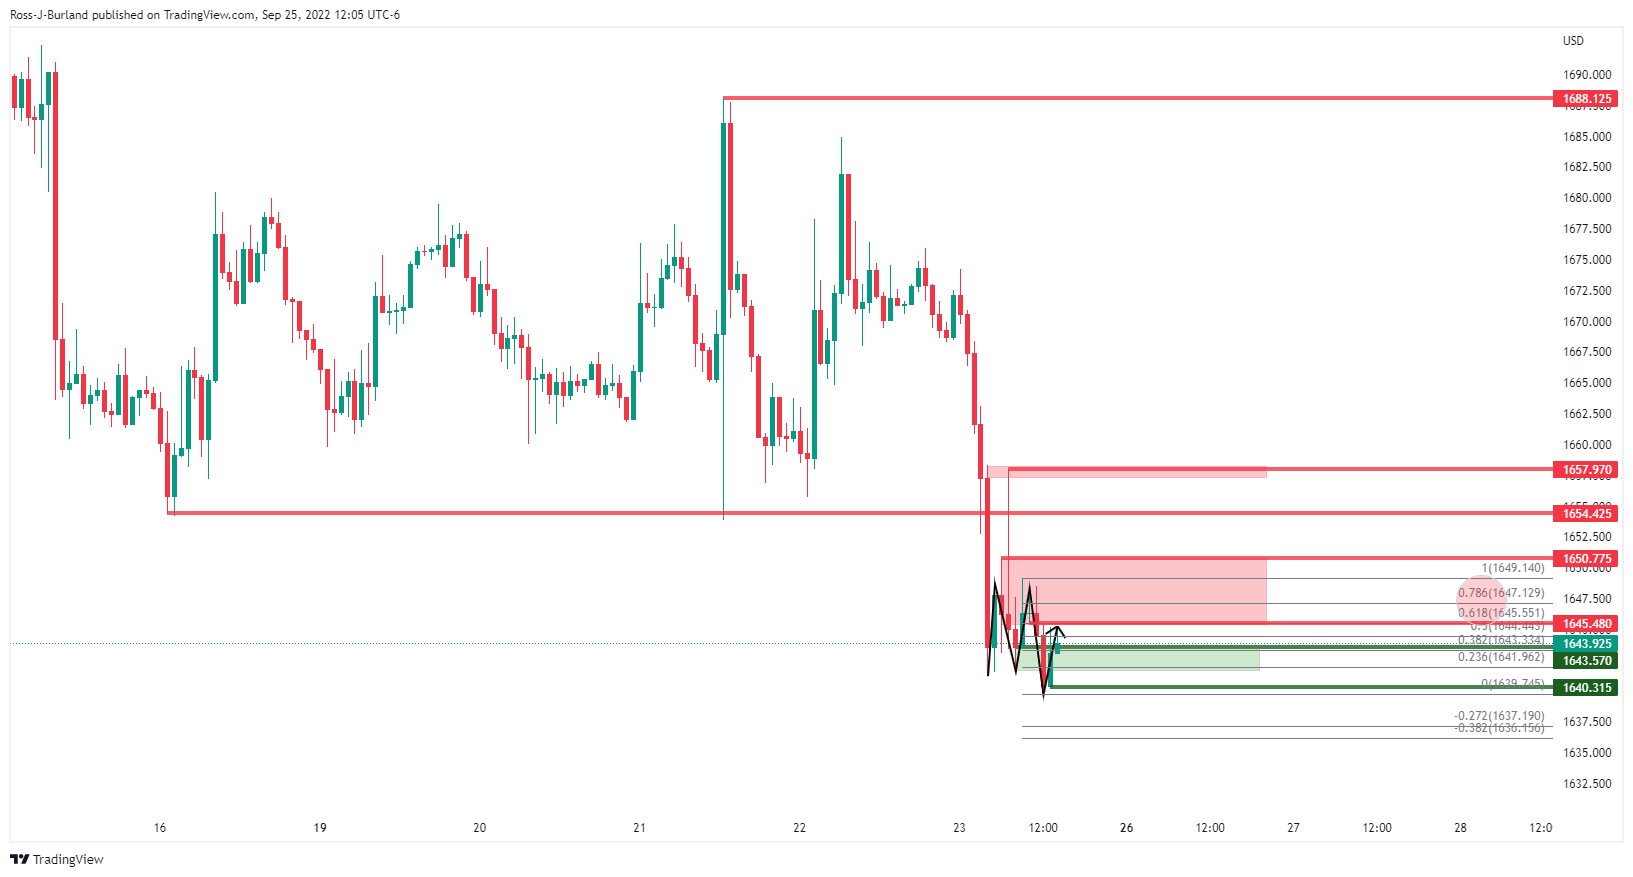
On the other hand, the hourly chart has already seen a correction and if the bears commit to below 1,650, then the downside could play out a lot sooner, leaving the opening sessions as prospective bearish plays to start the week off. 

Premium

You have reached your limit of 3 free articles for this month.

Start your subscription and get access to all our original articles.

Subscribe to PremiumSign In

Author

Ross J Burland

Ross J Burland, born in England, UK, is a sportsman at heart. He played Rugby and Judo for his county, Kent and the South East of England Rugby team.

More from Ross J Burland
Share:

Editor's Picks

AUD/USD falls to near 0.7100 after slipping below 50-day EMA

AUD/USD depreciates after registering minor gains in the previous day, trading around 0.7120 during the Asian hours. The technical analysis of the daily chart shows the pair consolidating sideways within a rectangle pattern, as neither bulls nor bears gain control. The AUD/USD pair is holding a slight bearish tone however as it sits beneath both the nine-day and 50-day EMAs.

160.00: USD/JPY back near intervention territory after upbeat US jobs report

US Nonfarm Payrolls beat expectations by a wide margin in May, with 172K jobs added. The US Dollar rebounds after the release, helping USD/JPY recover from its intraday lows. Warnings from Japanese authorities continue to limit upside potential near the 160.00 threshold.

Gold targets $4,300 amid stronger Dollar

Gold faces increasing selling interest and navigates the area of three-month lows near the $4,300 mark per troy ounce on Friday. The precious metal’s decline comes as traders assess the stronger-than-expected NFP, while the bid bias in the Greenback and higher US Treasury yields also collaborate with the retracement.

Cardano hits five-year low even as Hoskinson clarifies "break" isn't an exit

Cardano (ADA) price is down 10% at press time on Friday, extending losses over 30% so far this week amid Charles Hoskinson's clarification that "break" isn't an exit.

Week ahead – Fed countdown begins amid US inflation data and geopolitical risks

Fed Chair Warsh’s first meeting approaches as key US inflation data could reshape expectations. Oil prices remain elevated as US-Iran talks continue; tariffs also return to the spotlight. ECB is expected to hike; will it be a one-off move or is July live?

The US economy defies the rules: 100 days into the Oil shock and the recession signal is still missing

More than three months after the start of the Iran war and the resulting disruption to global energy markets, the US economy continues to display remarkable resilience. The conflict has triggered a sharp rise in Oil prices, reignited inflationary pressures and fueled widespread concerns about a potential economic slowdown.