Gold, Chart of the Week: XAU/USD bears in the market, bias lower while below $2,030s
- Gold price is setting up for a potential short from the highs of the initial balance of the week.
- Bears eye a retest of the $2,000 market and below while under the $2,030s.

Should the correction start to decelerate within the highlighted area of potential resistance, bears could be encouraged to take on the support area between $1,970 and $1,990.
Gold price closed lower on Friday after an unexpectedly robust US Nonfarm Payrolls report whereby the United States added 253,000 new jobs in April, well ahead of the consensus estimate for a rise of 180,000.
The market now needs to consider a scenario whereby the Federal Reserve needs to back away from an expected pause in rate hikes. Consequently, bond yields were higher, bearish for gold since it offers no interest. The US two-year note was last seen paying 3.916b, up 11.1 basis points, while the yield on the 10-year note was up 6.8 basis points to 3.454%
Prior to the data, money managers started acquiring gold positions once more, as continued stress in the banking sector simultaneously forced shorts to cover ahead of the Federal Open Market Committee and raised confidence that the Fed has increasingly reached 'near terminal' rates.
´´The market has begun sniffing out a pause, which tends to drive discretionary positioning in the yellow metal higher on a lagged basis,´´ analysts at TD Securities said. ´´This points to a substantial and continued rise in gold length on the horizon, given the last pause and cutting cycle saw discretionary gold positioning rise substantially more than its current levels,´´ the analysts explained.
Gold price weekly charts
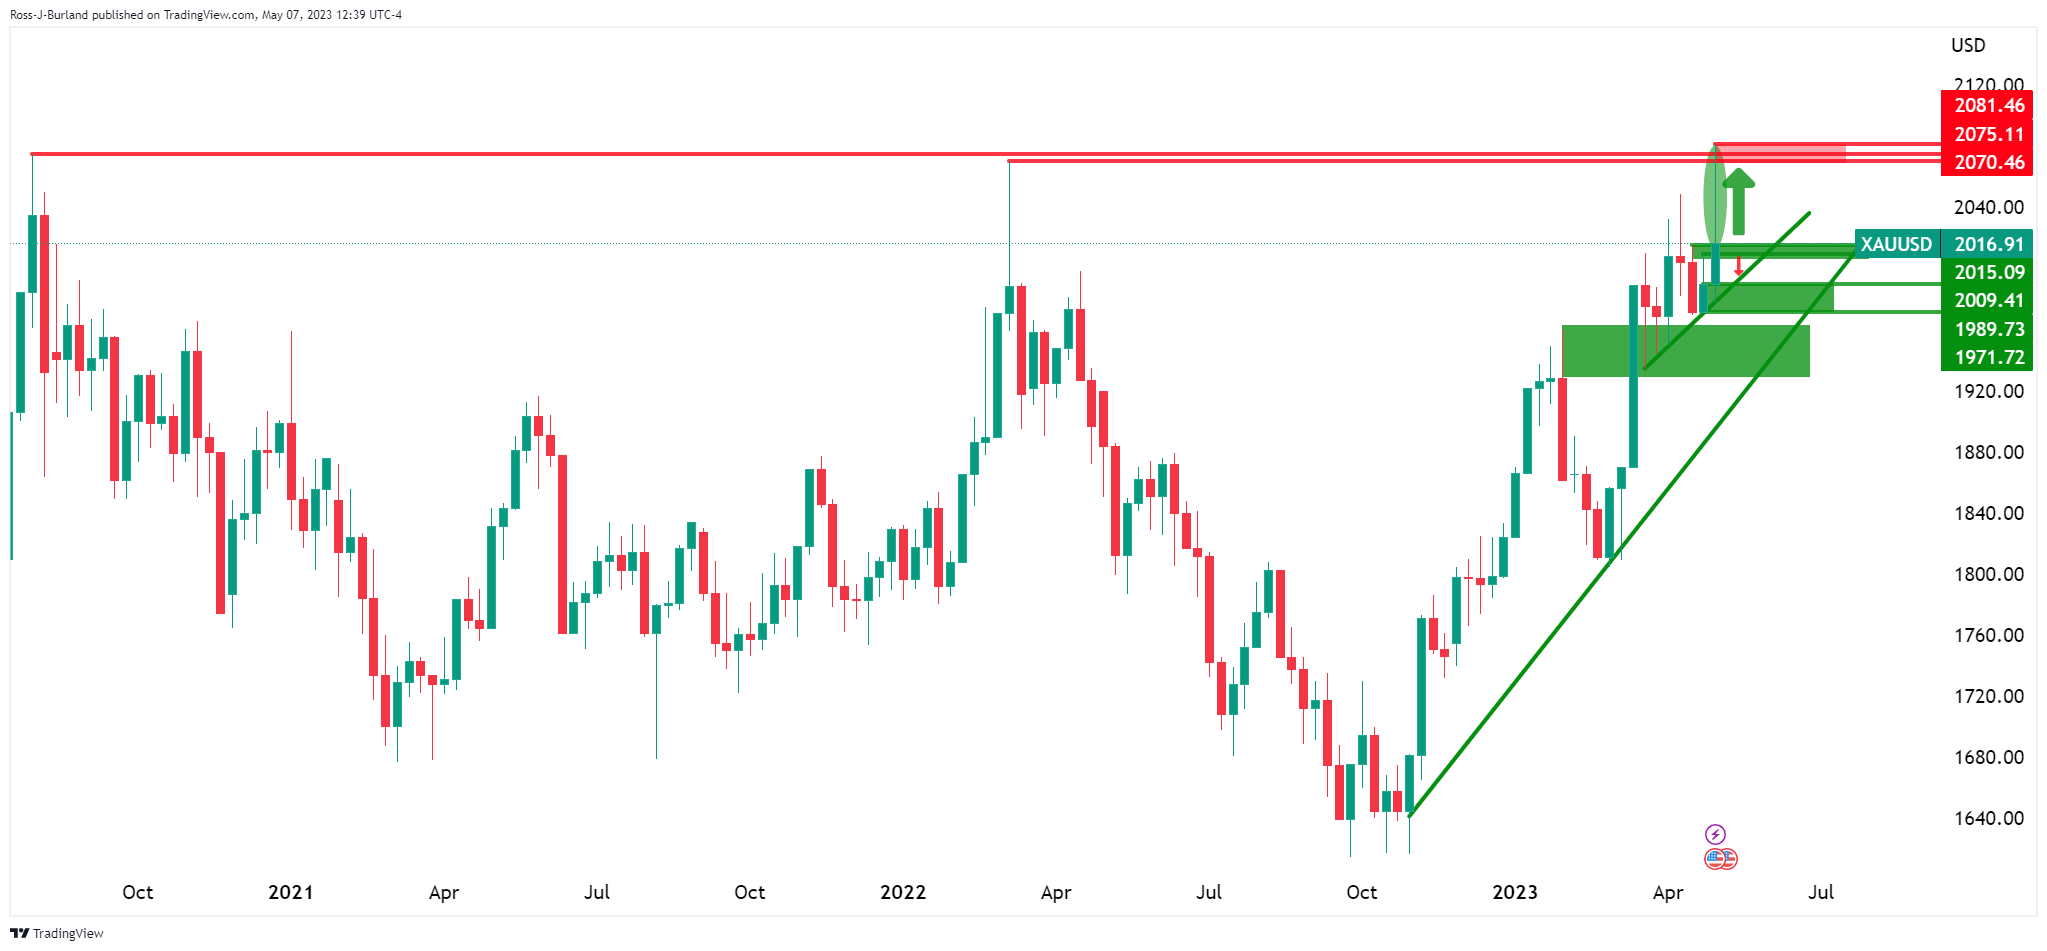
The wick on last week´s candle could be eyed as an opportunity for the week ahead to fill the wick.
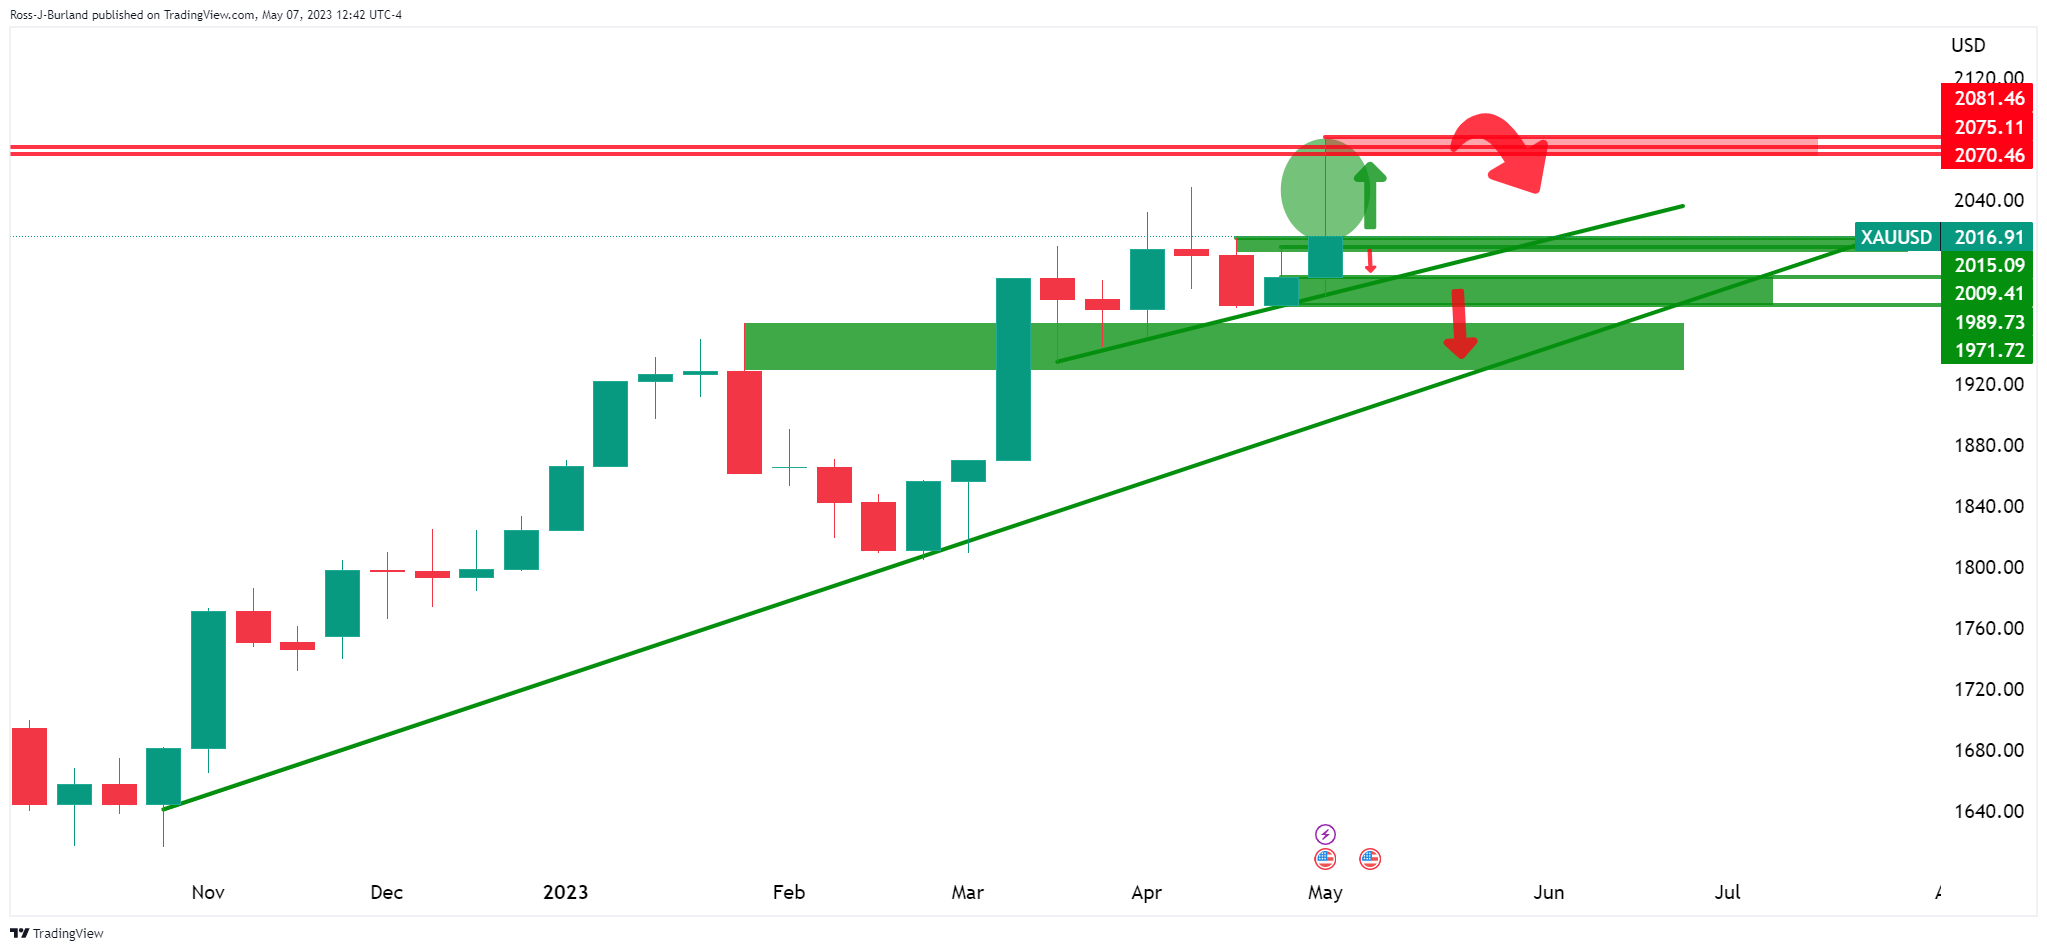
Gold price daily charts
The daily chart shows a number of key areas that would need to hold if the bullish thesis is going to stick. For one, the bulls will need to stay front side of the trendline supports. $2,000 and $1,970 are key in this regard.
However, the W-formation and the strong sell-off on Friday are problematic. The bulls will need to commit to the said levels and around trendline support.
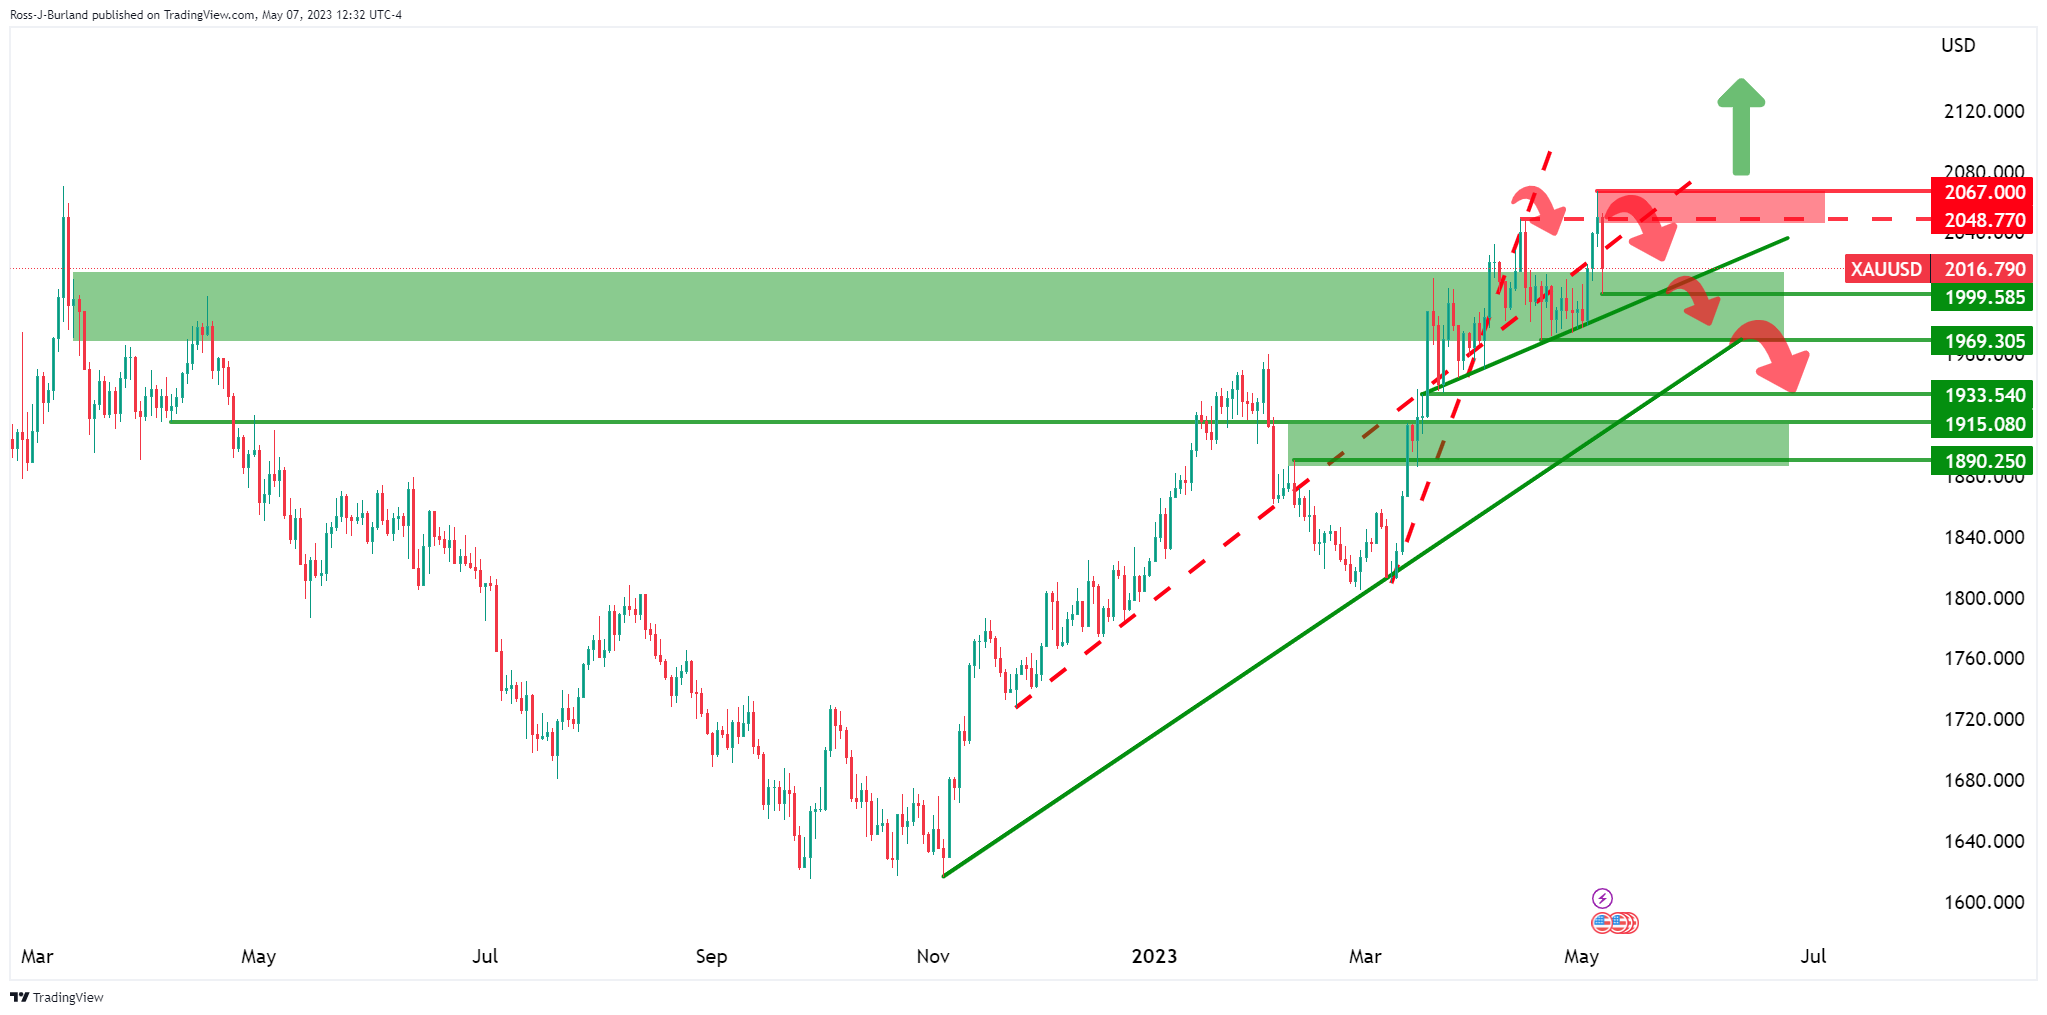
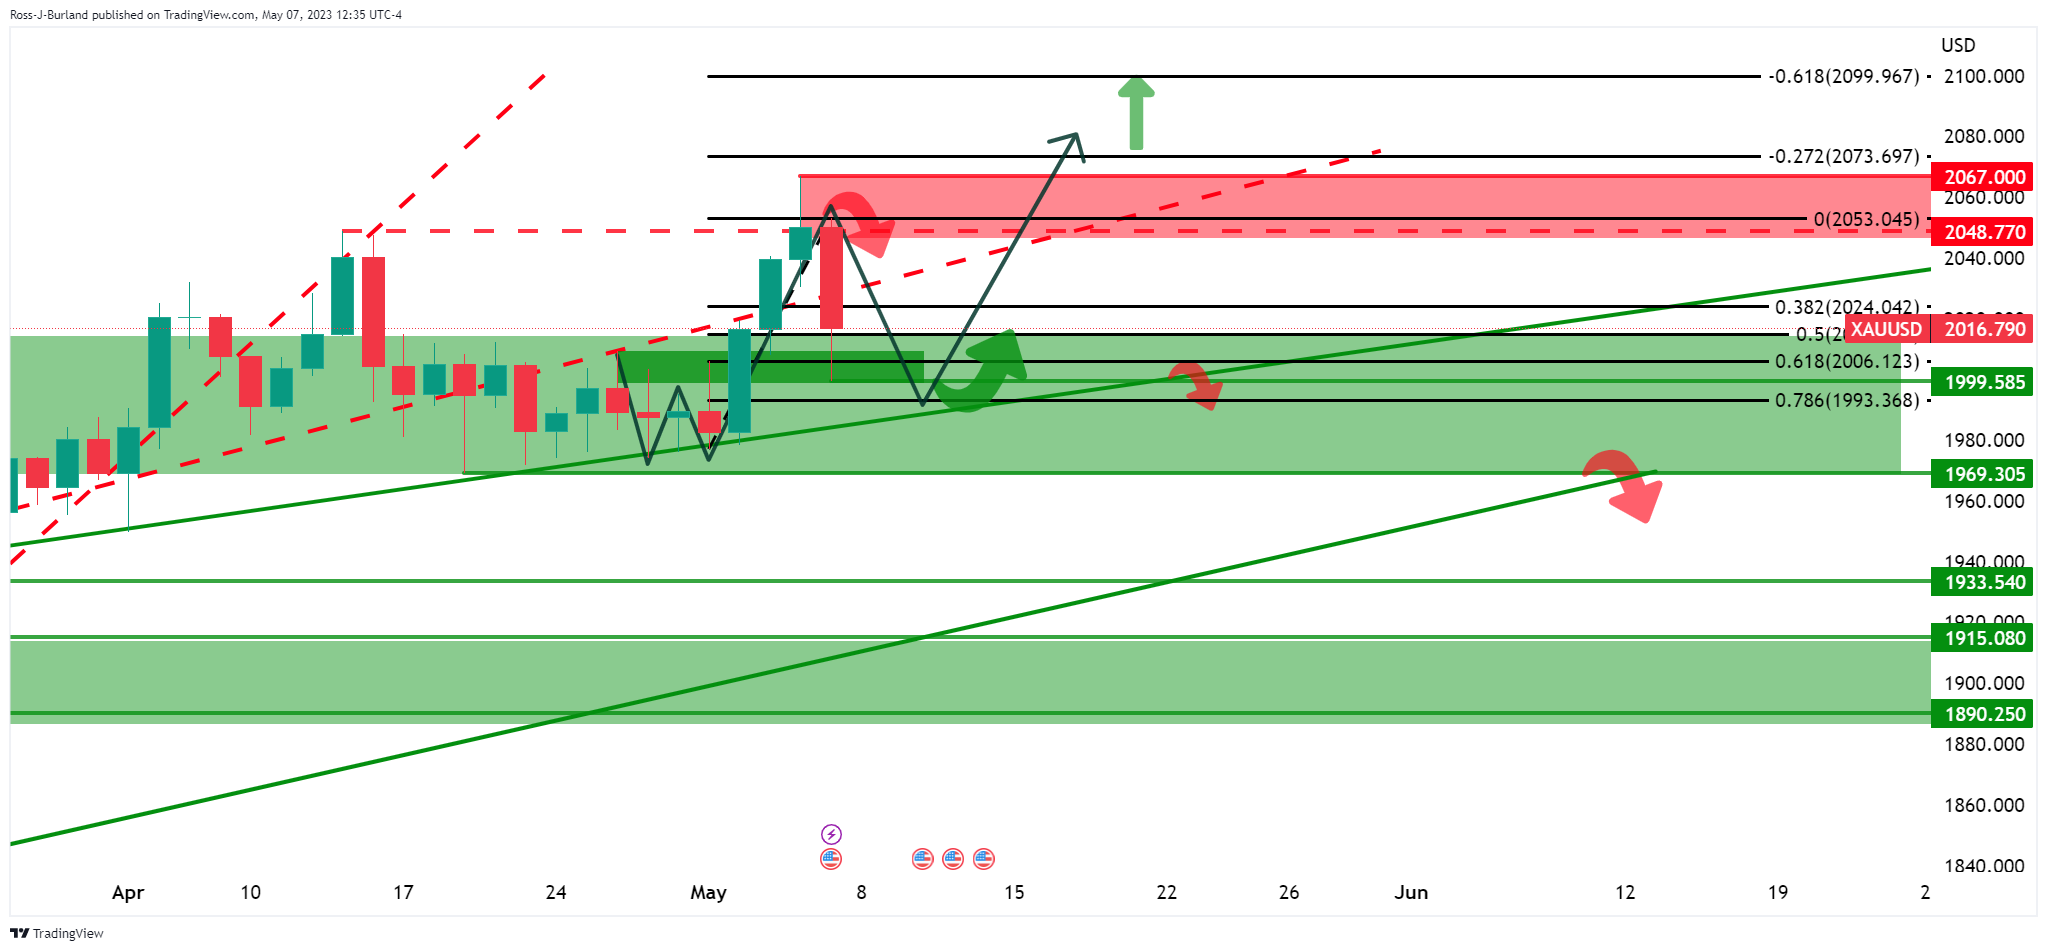
Gold, H4 chart
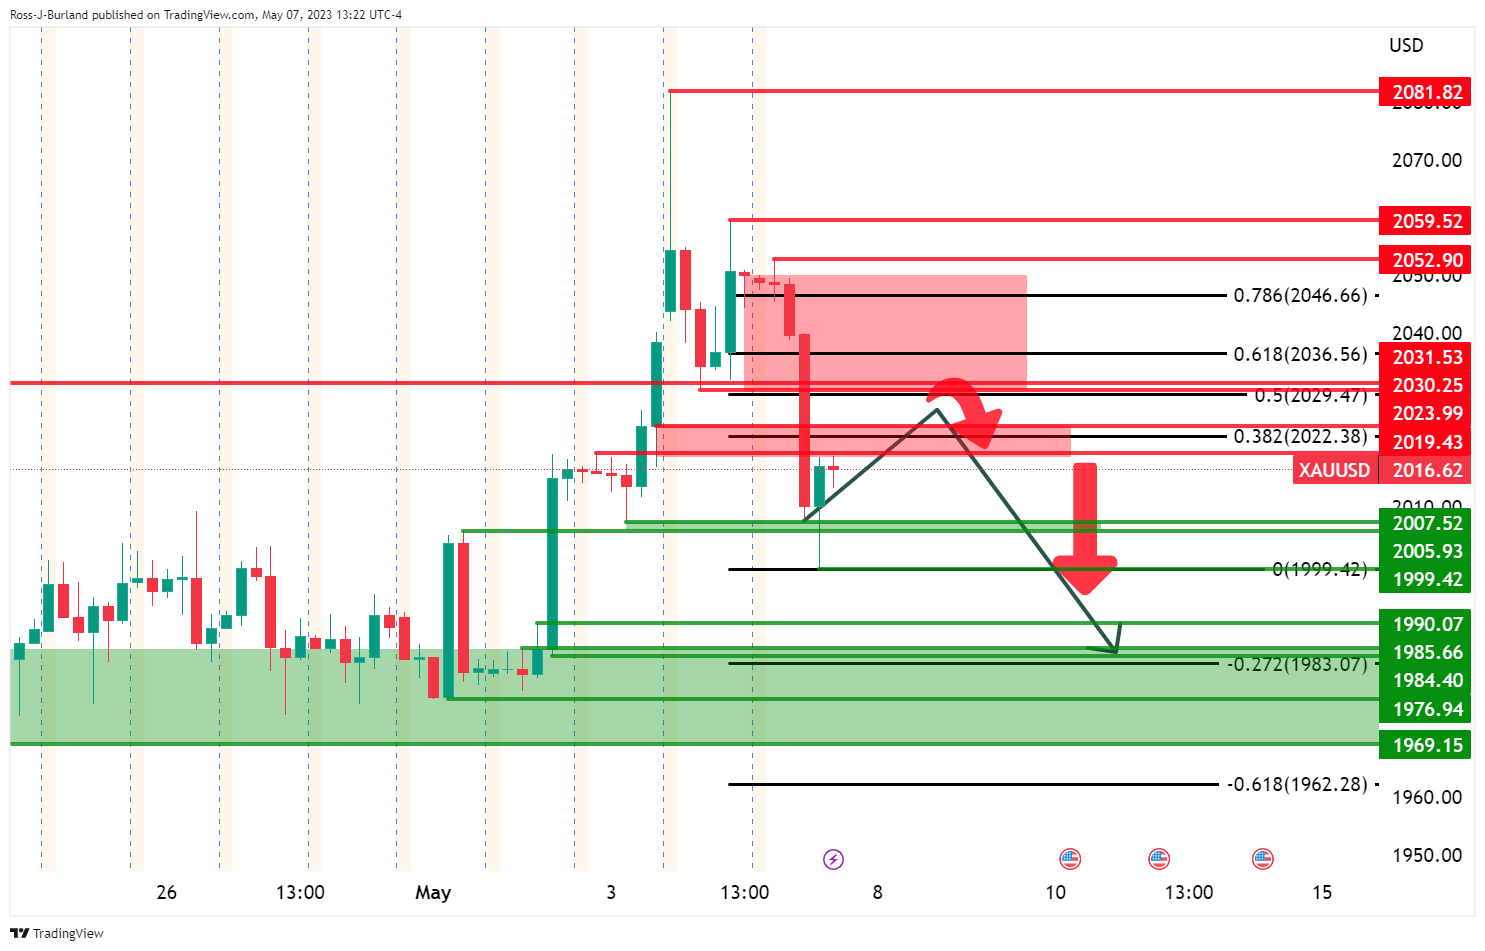
From a 4-hour perspective, the said support area does look vulnerable considering the current formation of the schematic that is playing out before us. Should the correction start to decelerate within the highlighted areas of potential resistance, bears could be encouraged to take on the support area between $1,970 and $1,990. Therefore, the bias is bearish while below $2,050 and nearer term, the $2,030s.
Premium
You have reached your limit of 3 free articles for this month.
Start your subscription and get access to all our original articles.
Author

Ross J Burland
FXStreet
Ross J Burland, born in England, UK, is a sportsman at heart. He played Rugby and Judo for his county, Kent and the South East of England Rugby team.


