Gold, Chart of the Week: Bears eye the 38.2% Fibonacci for the open
- Gold bears are in control and eye a downside continutation.
- The 38.2% Fibo is on focus for the week ahead.

The price of gold is stalling and bulls have run out of steam, leaving the yellow metal vulnerable to a deeper consolidation if prices fail to hold above the $1,840/oz region. The following is an illustration of how the bias is to the downside at the moment taking into account the weekly, daily and lower time frames:
Gold weekly chart
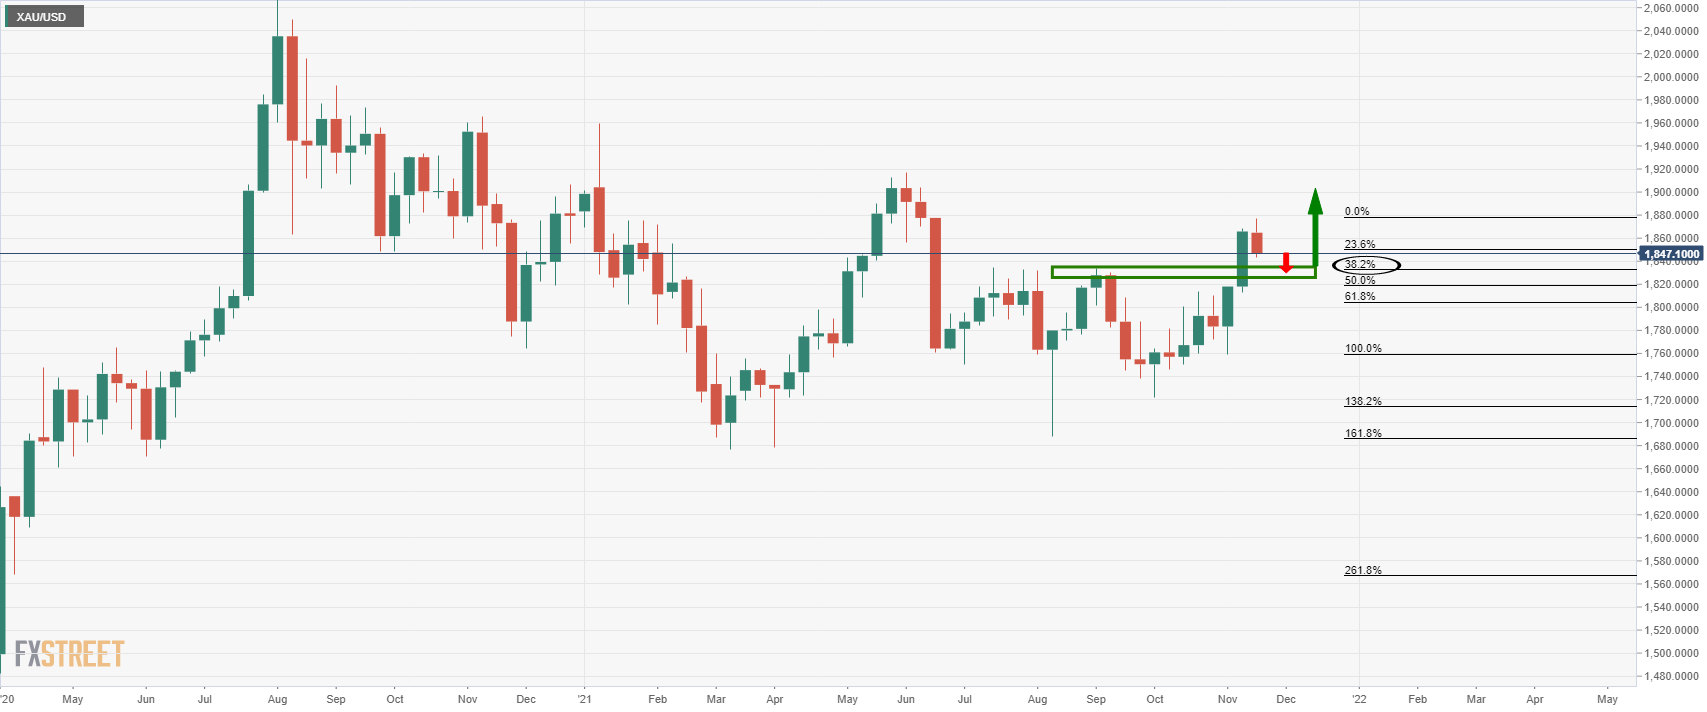
There is a bias to the downside here until the 38.2% Fibo is reached that marks the prior highs that would be expected to act as support on initial tests.
Gold daily chart
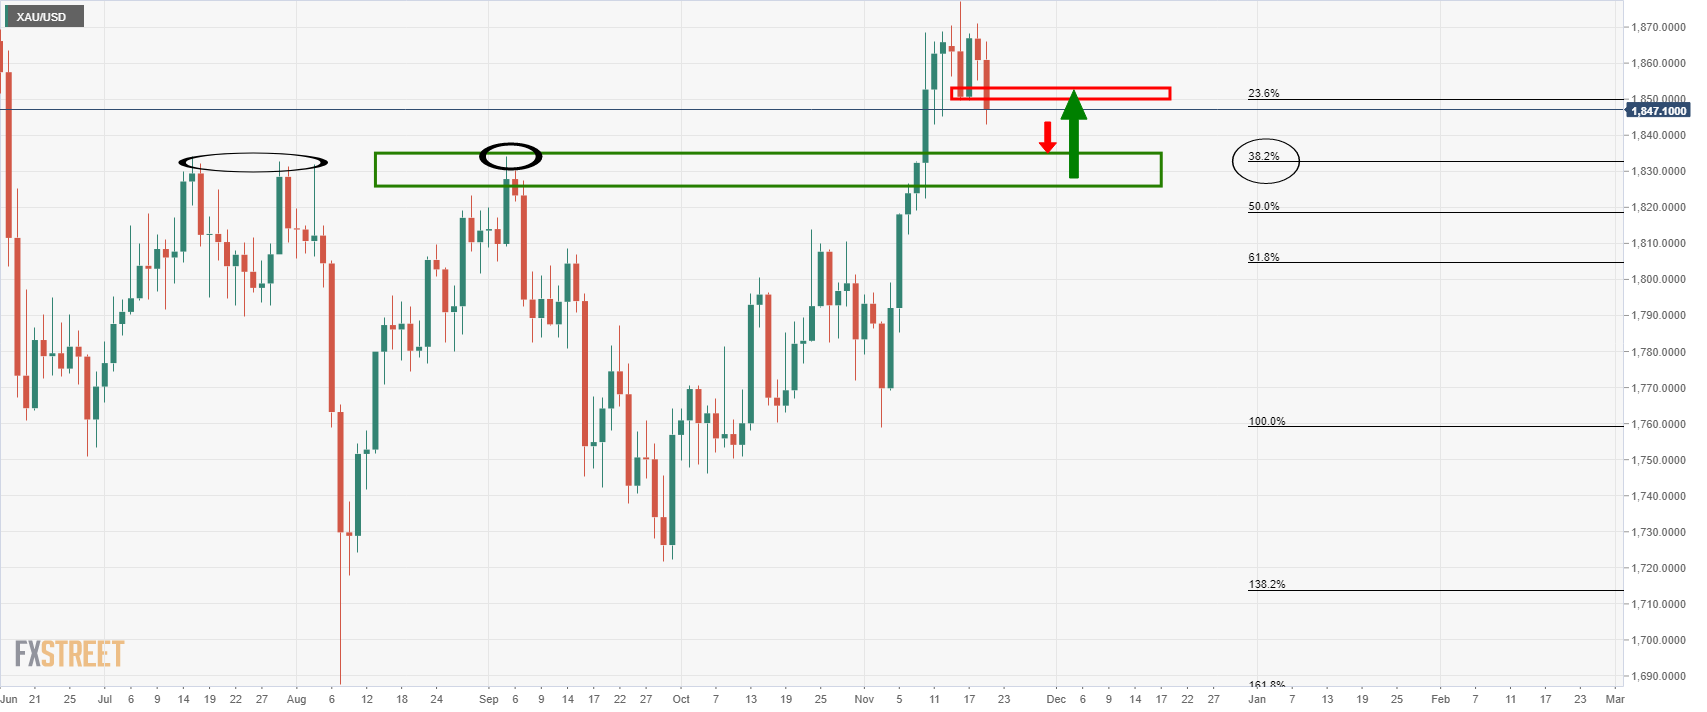
The price is breaking below the prior daily lows and would be expected to continue lower until the prior resistance.
Gold H4 chart
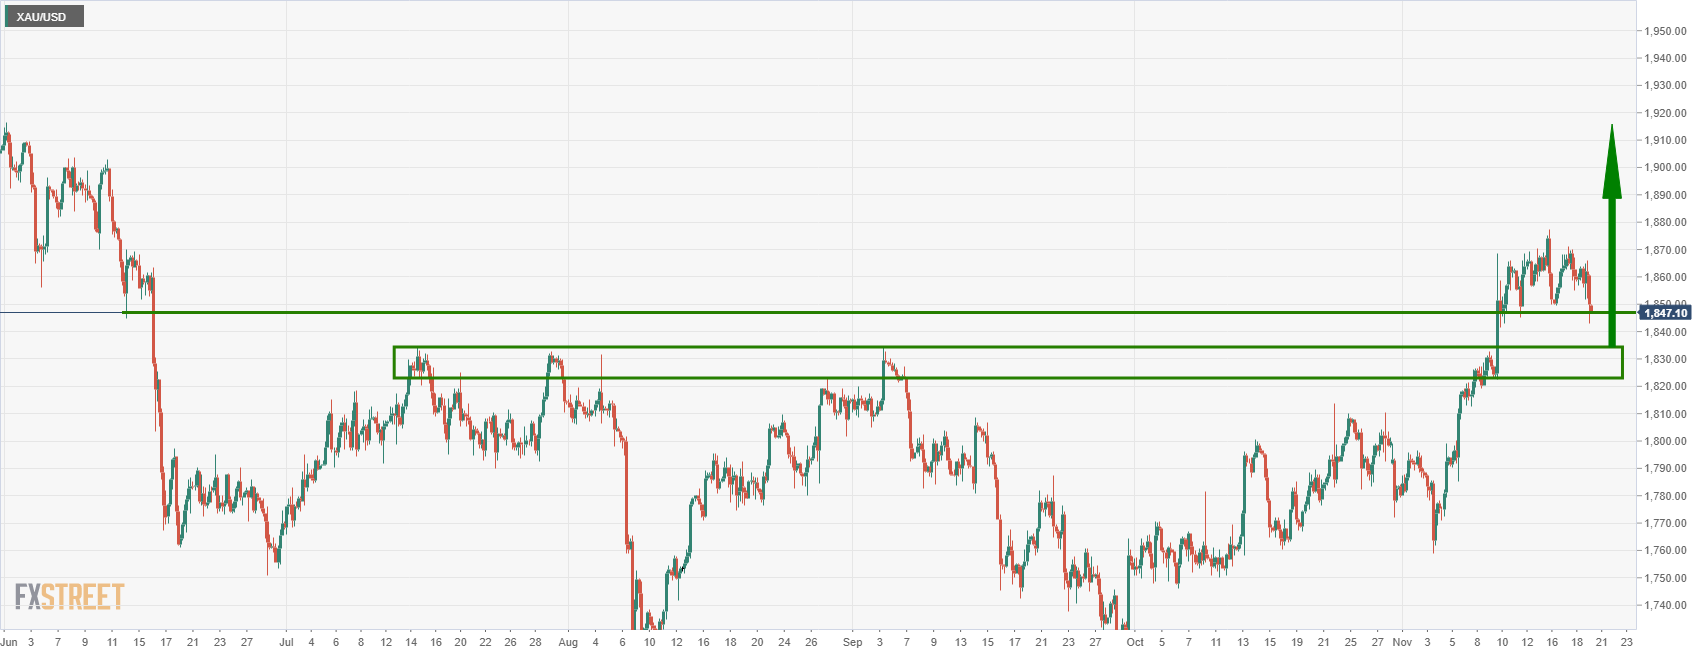
From a lower time frame perspective, the price is meeting short term support but the price action is strongly bearish and a continuation to the downside would be expected at this juncture.
Author

Ross J Burland
FXStreet
Ross J Burland, born in England, UK, is a sportsman at heart. He played Rugby and Judo for his county, Kent and the South East of England Rugby team.


