Gold, Chart of the Week: $1,935 before lower for longer levels?
- Gold bulls are moving in at critical weekly levels.
- However, a break of weekly support remains on the cards.

Talk of a possible 75 bps increase in the Fed Funds rate at this week's meeting has sent the US dollar to 20-year highs and has weighed on the Gold Price. The yellow metal is now testing a critical level of support near $1,880 which will be a key level during a busy week ahead.
The following illustrates the market structure across the weekly, daily and four-hour time frame putting some perspective on the recent price action, arriving at a bearish bias longer term.
Gold weekly chart
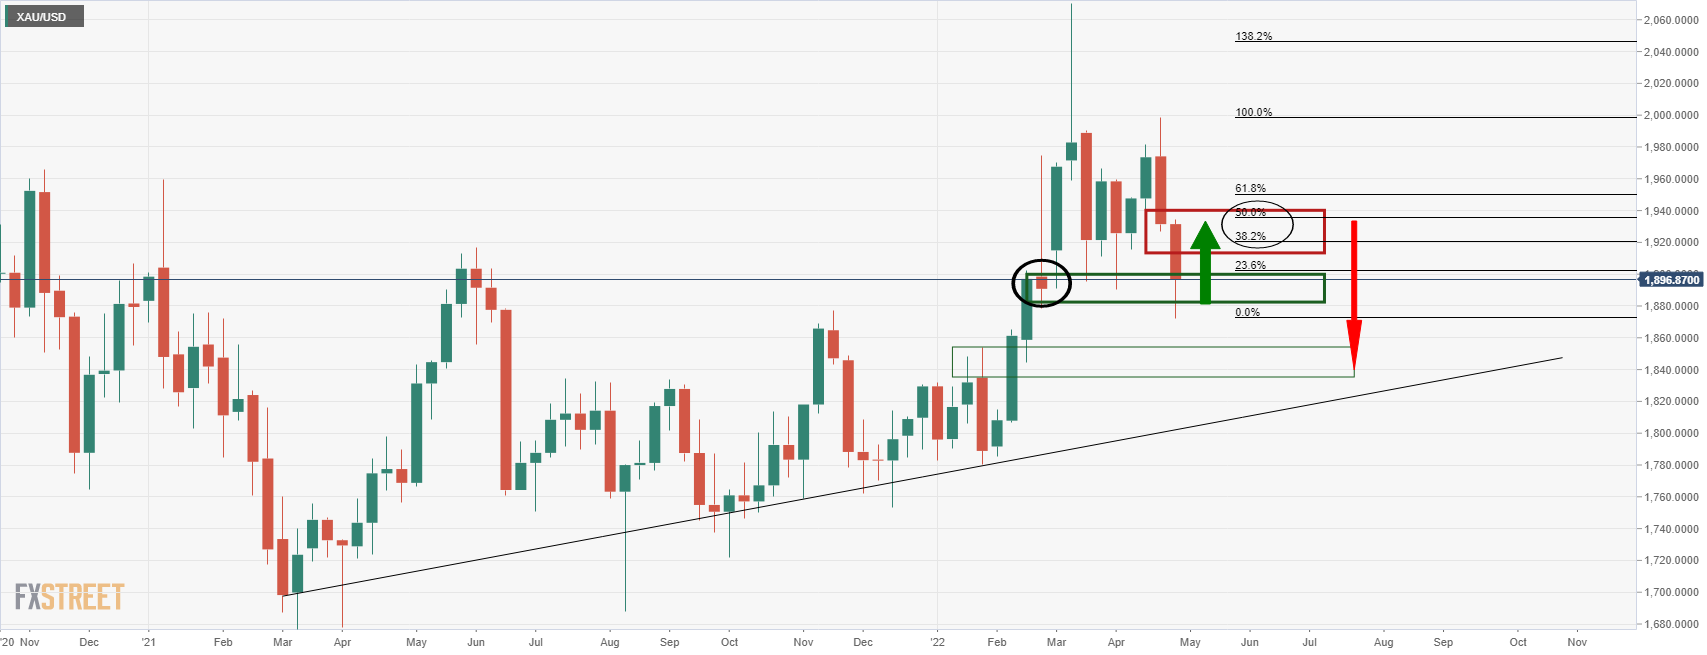
The weekly chart shows the price attempting to break out to the downside, so far being held up at the weekly structure. This leaves prospects of a meanwhile bullish correction to retest the prior lows.
XAU/USD daily chart
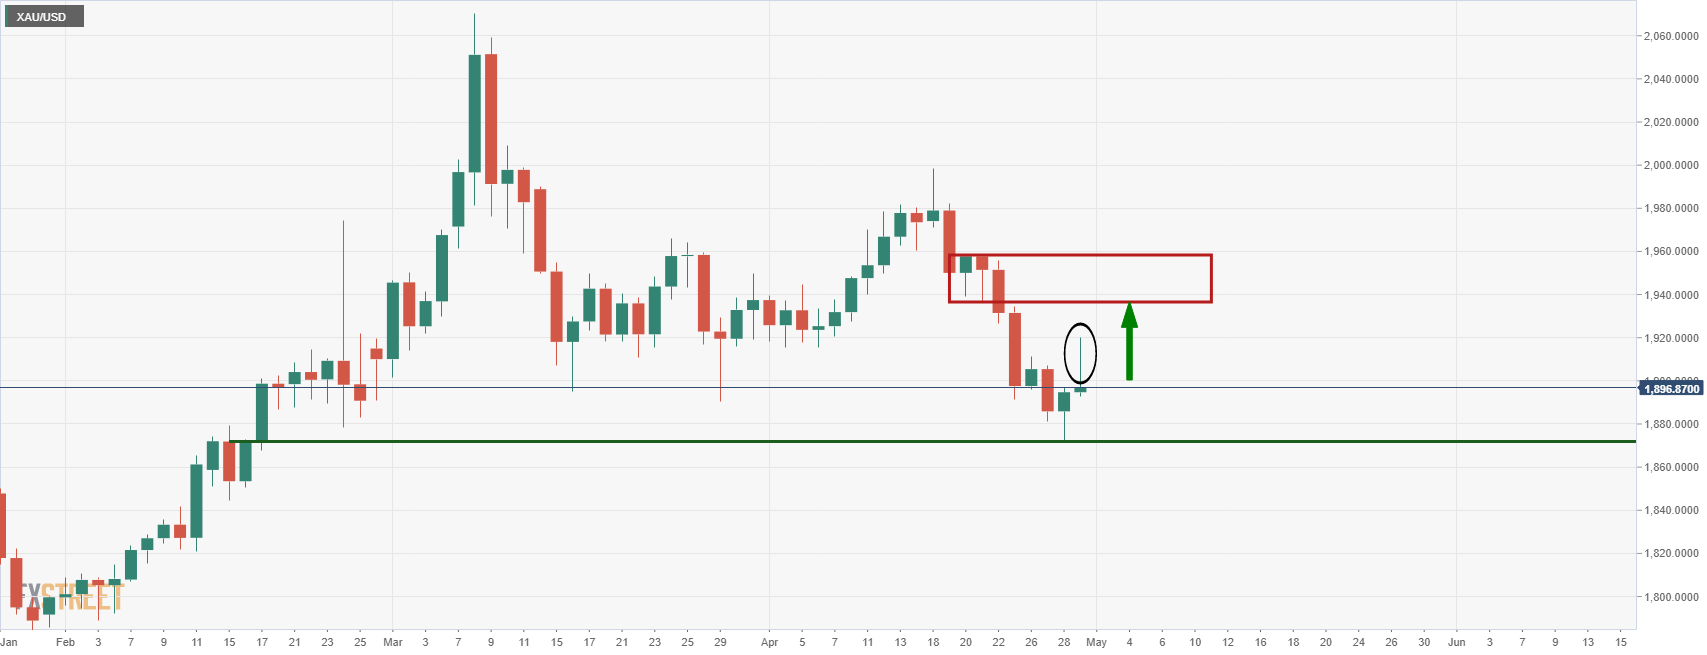
Friday's bullish close, short body and long wick leave prospects of a move higher for the opening sessions to at least fill the wick if not move in on the prior daily lows.
Gold H4 chart
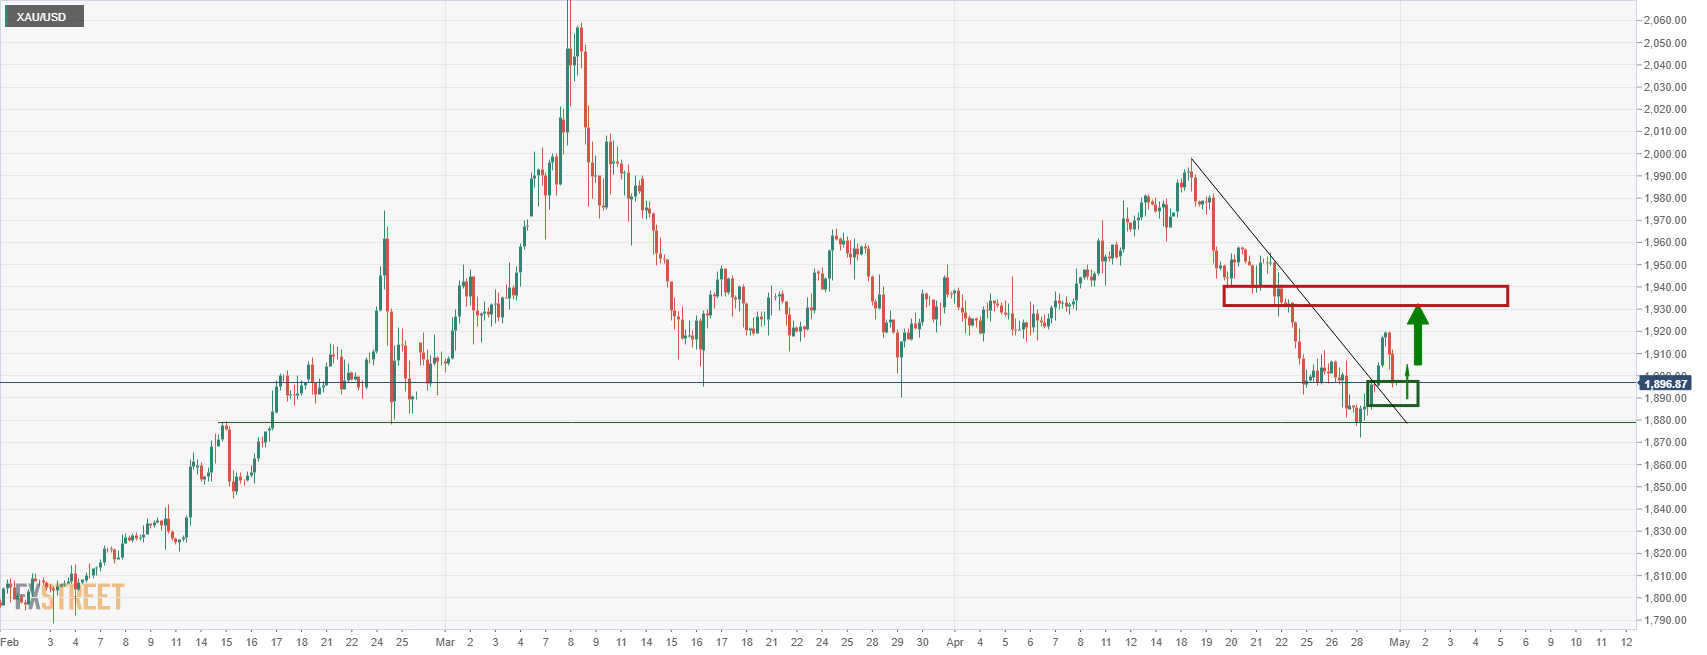
The four-hour chart shows that the price is accumulating and should the support hold, then the bulls will be eyeing the aforementioned resistance area.
However, as analysts at TD Securities argue, ''the prospect of progressively more aggressive monetary tightening from the Federal Reserve and very hawkish policy signal implies this implies that any rallies, like the one over the last few days, may have a limited life span and long liquidations may be a fact of life well into the second half of the year.''
Author

Ross J Burland
FXStreet
Ross J Burland, born in England, UK, is a sportsman at heart. He played Rugby and Judo for his county, Kent and the South East of England Rugby team.


