Gold buyers confront one-month high as market sentiment shifts

Market overview
Gold prices have surged to their highest level in a month as market participants brace for increased volatility under Donald Trump's second term as U.S. president. The precious metal, traditionally regarded as a safe-haven asset, is reacting to a complex interplay of U.S. policy changes and Federal Reserve monetary stance. Trump’s administration has pledged to impose new trade tariffs on neighboring countries and address the trade deficit with China. While these measures could strengthen the U.S. dollar, they might also create uncertainty that supports gold demand. Investors remain cautious as they weigh the potential implications of these policies on global trade and economic stability.
Technical analysis
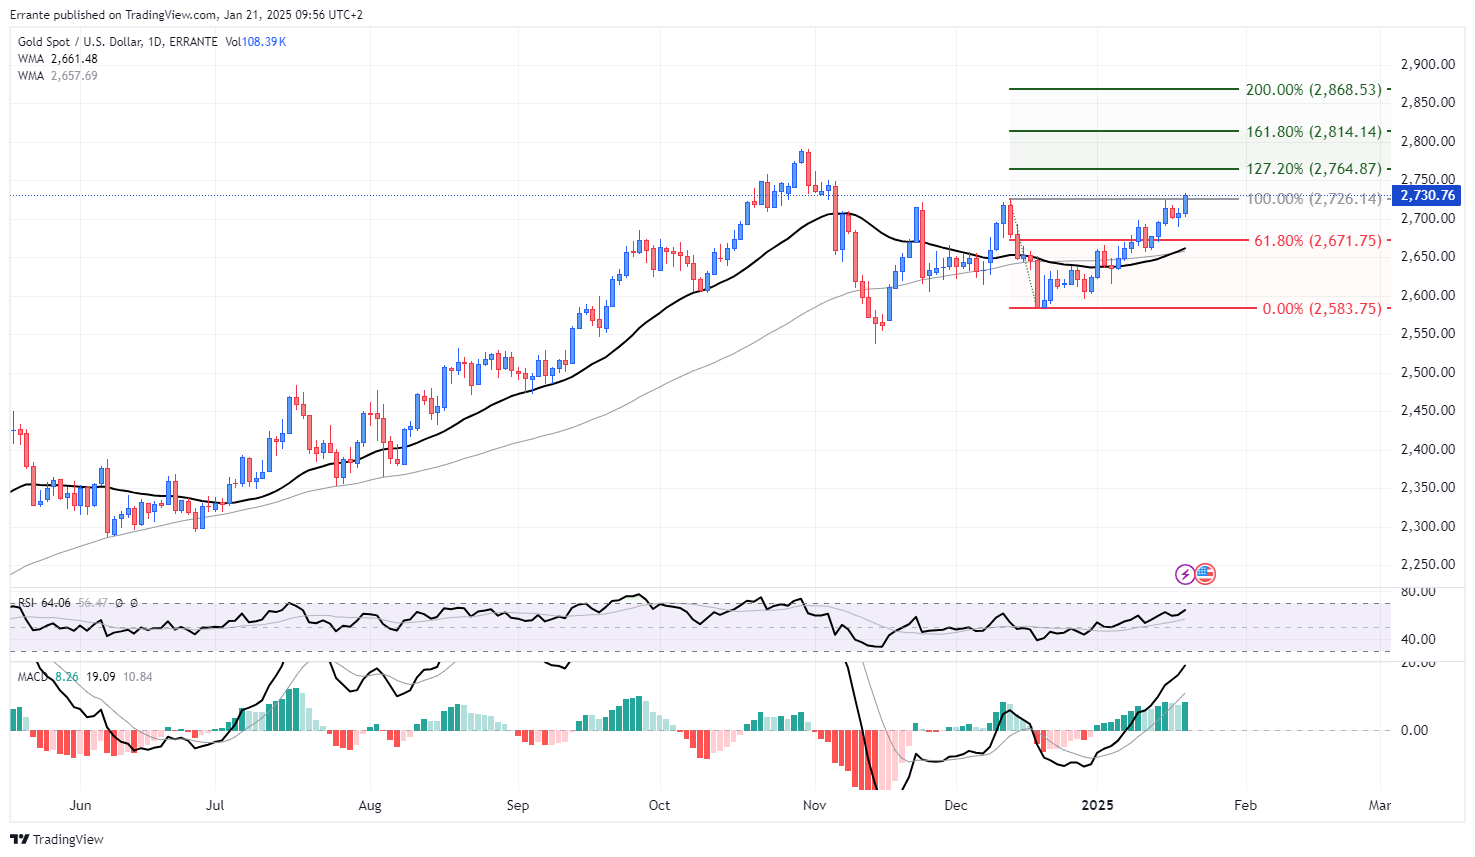
On the daily chart, gold is testing its one-month high, with buyers targeting the resistance level at $2726.14. A sustained breakout above this resistance could pave the way for further upside, with the next key targets at $2764.87, followed by $2814.14. The latter level aligns with the 161.8% Fibonacci extension of the previous downswing, while $2868.53, the 200% extension level, represents the ultimate bullish target in the current trend.
Momentum indicators support this bullish outlook. The RSI is trending upward, reflecting increasing buying interest without approaching overbought conditions. Similarly, the MACD histogram shows a positive divergence, with its signal line pointing to strengthening upward momentum. Meanwhile, moving averages provide mixed signals, with shorter-term averages supporting the recent rally while longer-term averages lag slightly behind.
Conversely, failure to maintain gains above $2726.14 could signal a potential reversal. Sellers would need to push prices below the key support at $2671.75 to regain control. A decisive break below this level would expose further downside targets, with the next major support zone at $2583.75, marking a significant turning point for the broader trend.
Oscillators and risk warnings
-
RSI: Bullish, reflecting rising momentum while avoiding overbought conditions.
-
MACD: Positive, indicating strengthening upward momentum.
-
Moving Averages: Mixed, with shorter-term averages supporting the bullish outlook while longer-term averages show lagging confirmation.
Key technical levels
-
Resistance Levels: $2726.14, $2764.87, $2814.14, $2868.53.
-
Support Levels: $2671.75, $2583.75.
Fundamental factors
Fundamental dynamics are shaping the gold market amid a subdued U.S. economic calendar. While Tuesday's schedule focuses on Treasury auctions, market participants are more attuned to potential headline risks stemming from the White House. Historically, Trump’s policy announcements have overshadowed routine economic releases, causing heightened volatility across financial markets.
Moreover, the Federal Reserve’s stance remains a pivotal factor. With recent hints of a steady monetary policy path, any divergence in sentiment could either bolster the dollar or create tailwinds for gold. Trade tensions and geopolitical uncertainties are also likely to play a significant role in the coming weeks, further influencing gold's trajectory.
Conclusion
Gold's near-term trajectory hinges on its ability to break through the one-month high resistance at $2726.14. If buyers maintain momentum, higher levels remain attainable, particularly at $2764.87 and beyond. However, a failure to sustain the breakout could invite sellers to test key support zones, potentially reversing the bullish outlook.
Author

Ali Mortazavi
Errante
BEc, CMSA, Member of IFTA - International Federation of Technical Analysis, Associate Member of STA - Society of Technical Analysis (UK).


