Gold bulls in Pole position before US election
-
This article reviews the critical breakout level for a bullish trend. We will also analyze how deep a bearish pullback can go.
-
We are still expecting wave C (orange). This should complete wave 2 (purple). A bullish breakout and shallow flag would indicate, however, an immediate bullish breakout.
-
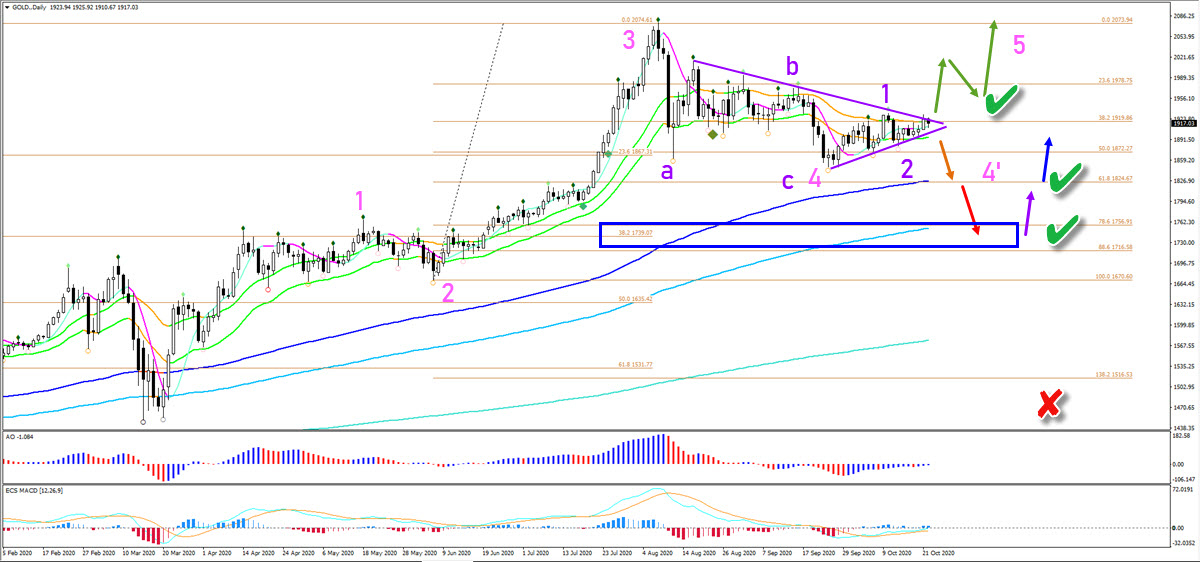
The XAU/USD is testing the 21 ema zone resistance. A bullish breakout above the Fractal and resistance trend line (purple) confirms the uptrend continuation (green arrows).

Gold (XAU/USD) is moving sideways in the 21 ema zone. But price action recently bounced at the Fibonacci support levels.
Price Charts and Technical Analysis
The XAU/USD is testing the 21 ema zone resistance. A bullish breakout above the Fractal and resistance trend line (purple) confirms the uptrend continuation (green arrows).
A bullish break increases the probability of a wave 4 completed plus the start of the wave 5 (pink). Price will be building a wave 1-2-3 (purple) within that wave 5.
Alternatively, a bearish break (orange arrows) below the 21 ema zone could confirm a larger bearish pullback. In that case, price will first aim at the 61.8% Fibonacci retracement level. Which is where the alternative wave 4’ could end.
A break below the 61.8% Fib (red arrow) changes the short-term outlook but not the long-term bullishness. In that case, we should see a wave 4 but of a higher degree and a larger price swing. The main target and support zone is the 38.2% Fib of the larger swing (blue box). The uptrend is only unlikely if price falls deep (red x).
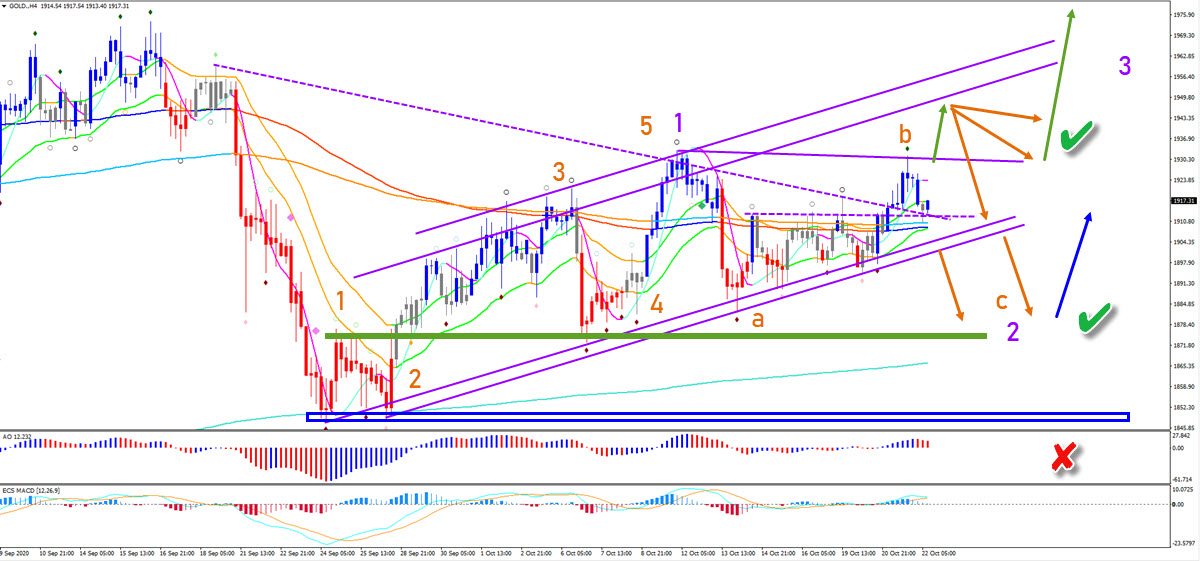
On the 4 hour chart, price action could be developing a wave 1-2 (purple). This is invalid (red x) if price action breaks below the bottom (blue box).
We are still expecting wave C (orange). This should complete wave 2 (purple). A bullish breakout and shallow flag would indicate, however, an immediate bullish breakout.
The analysis has been done with the ecs.SWAT method and ebook.
Author

Chris Svorcik
Elite CurrenSea
Experience Chris Svorcik has co-founded Elite CurrenSea in 2014 together with Nenad Kerkez, aka Tarantula FX. Chris is a technical analyst, wave analyst, trader, writer, educator, webinar speaker, and seminar speaker of the financial markets.


