Gold bullish above 200-day moving average

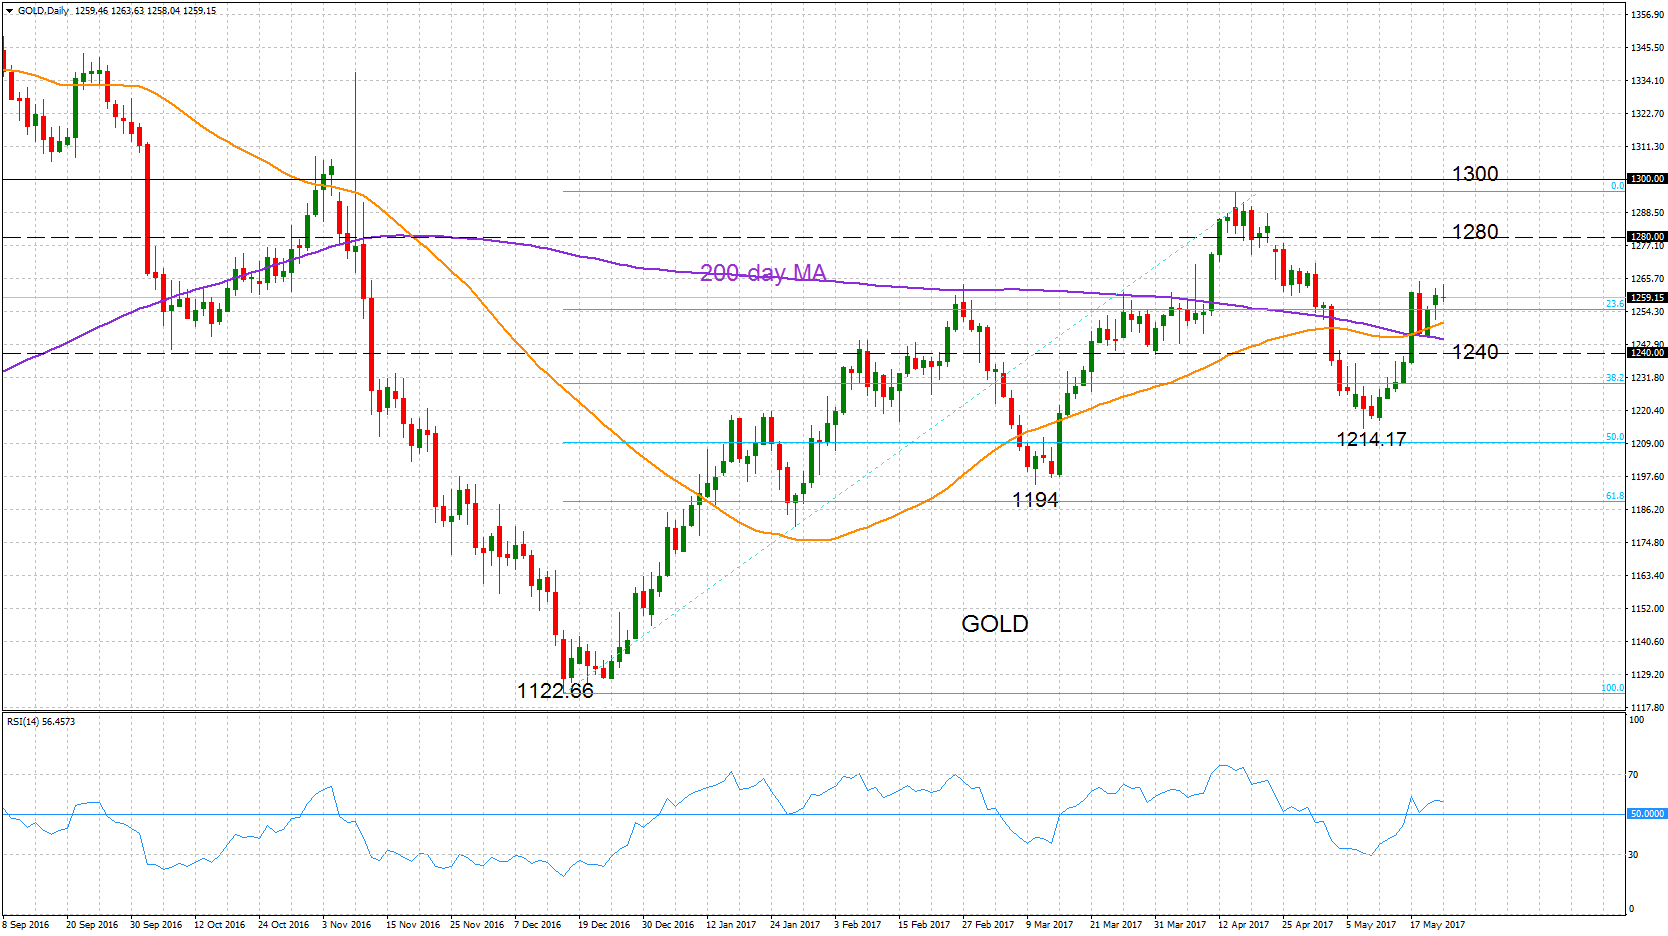
Gold maintains a bullish outlook after the market carved out higher highs and higher lows since December 2016. The uptrend from the 1122.66 low to the 6-month high of 1295.38 hit on April 17 is still in progress. Prices are now above the 23.6% Fibonacci retracement level of this uptrend, and this Fibonacci will act as immediate support just under 1255.
The crossover of the 50-day moving average with the 200-day MA on May 17 supports a bullish bias. The RSI is above 50 and is a further indication of bullishness in the market.
Resistance at 1280 could limit upside moves. This level would need to be cleared to open the way towards the key 1300 level. From here, the uptrend will be resumed and would confirm a higher low at 1214.17.
A breakdown of support at 1240 could accelerate a decline towards the low at 1214.17, and below this, the market would have retraced over 50% of the December to April uptrend and change the bias to bearish for the medium-term. Gold remains bullish as long as it holds above the 200-day moving average.
Author

Selena has a professional background of over 10 years spent in the financial industry, with a proven track record in her field of expertise. On obtaining her MA in Economics in 2002, Selena started her career as a Registered Futu


