Gold and stock market analysis for the week: Anticipating key moves from divergence [Video]
![Gold and stock market analysis for the week: Anticipating key moves from divergence [Video]](https://editorial.fxstreet.com/images/Markets/Commodities/Metals/Gold/Gold-bar-USDollar-XAUUSD_XtraLarge.jpg)
Gold has been in a sideways consolidation for over four months, with erratic movements making it challenging to predict the next move. On the daily chart, moving averages are flatlining, and we see a negative divergence with the slow stochastics trending downward, indicating a possible downturn at the start of this week.
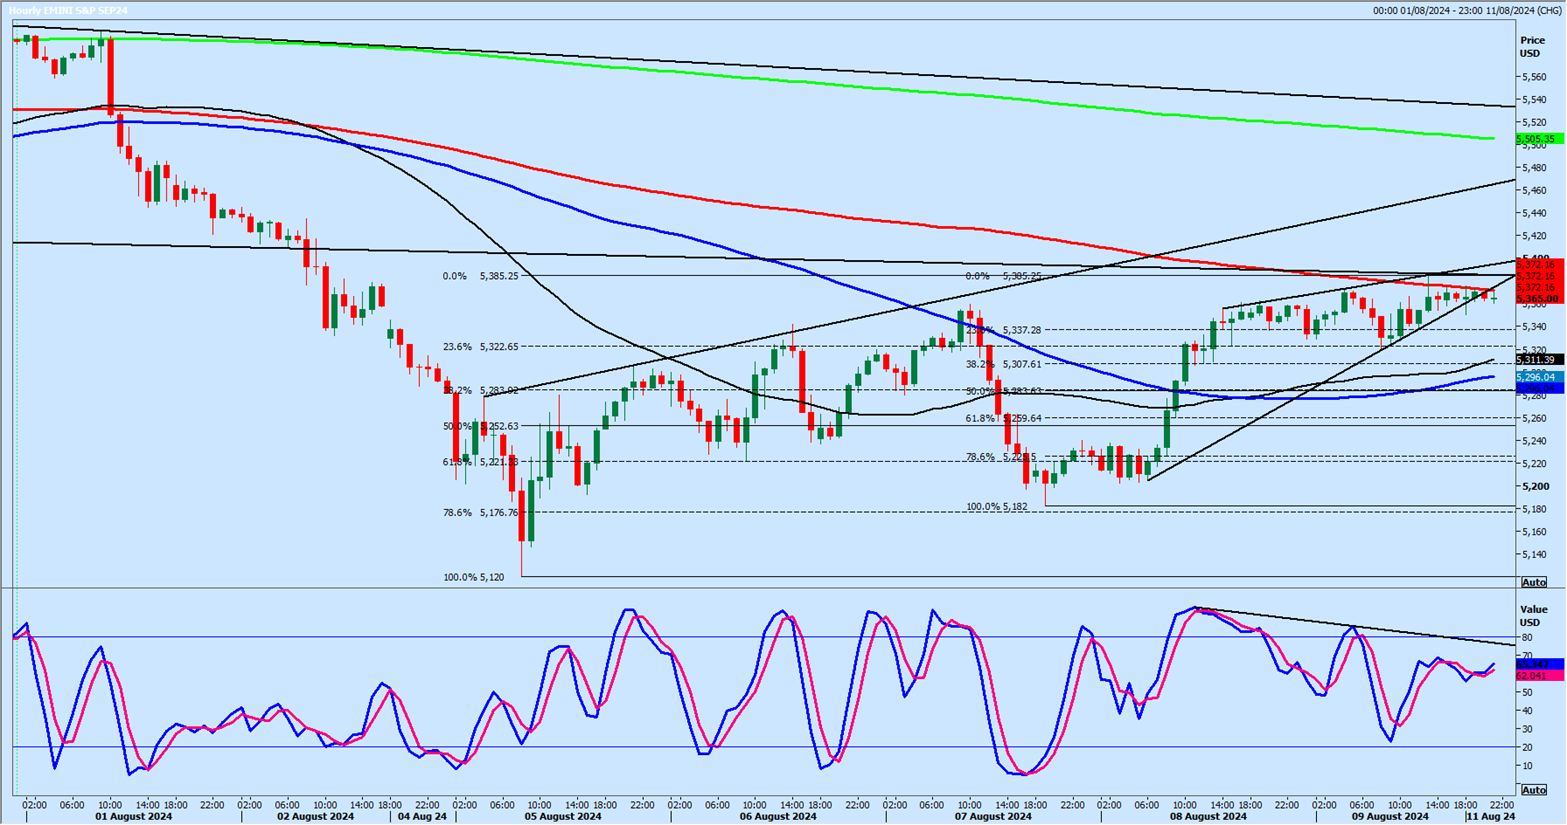
Similarly, the Emini S&P futures show an upward price trendline, but again, we have a negative divergence on the slow stochastic. The market is hovering just above the 100-day moving average—a crucial level that could dictate the direction for the week.
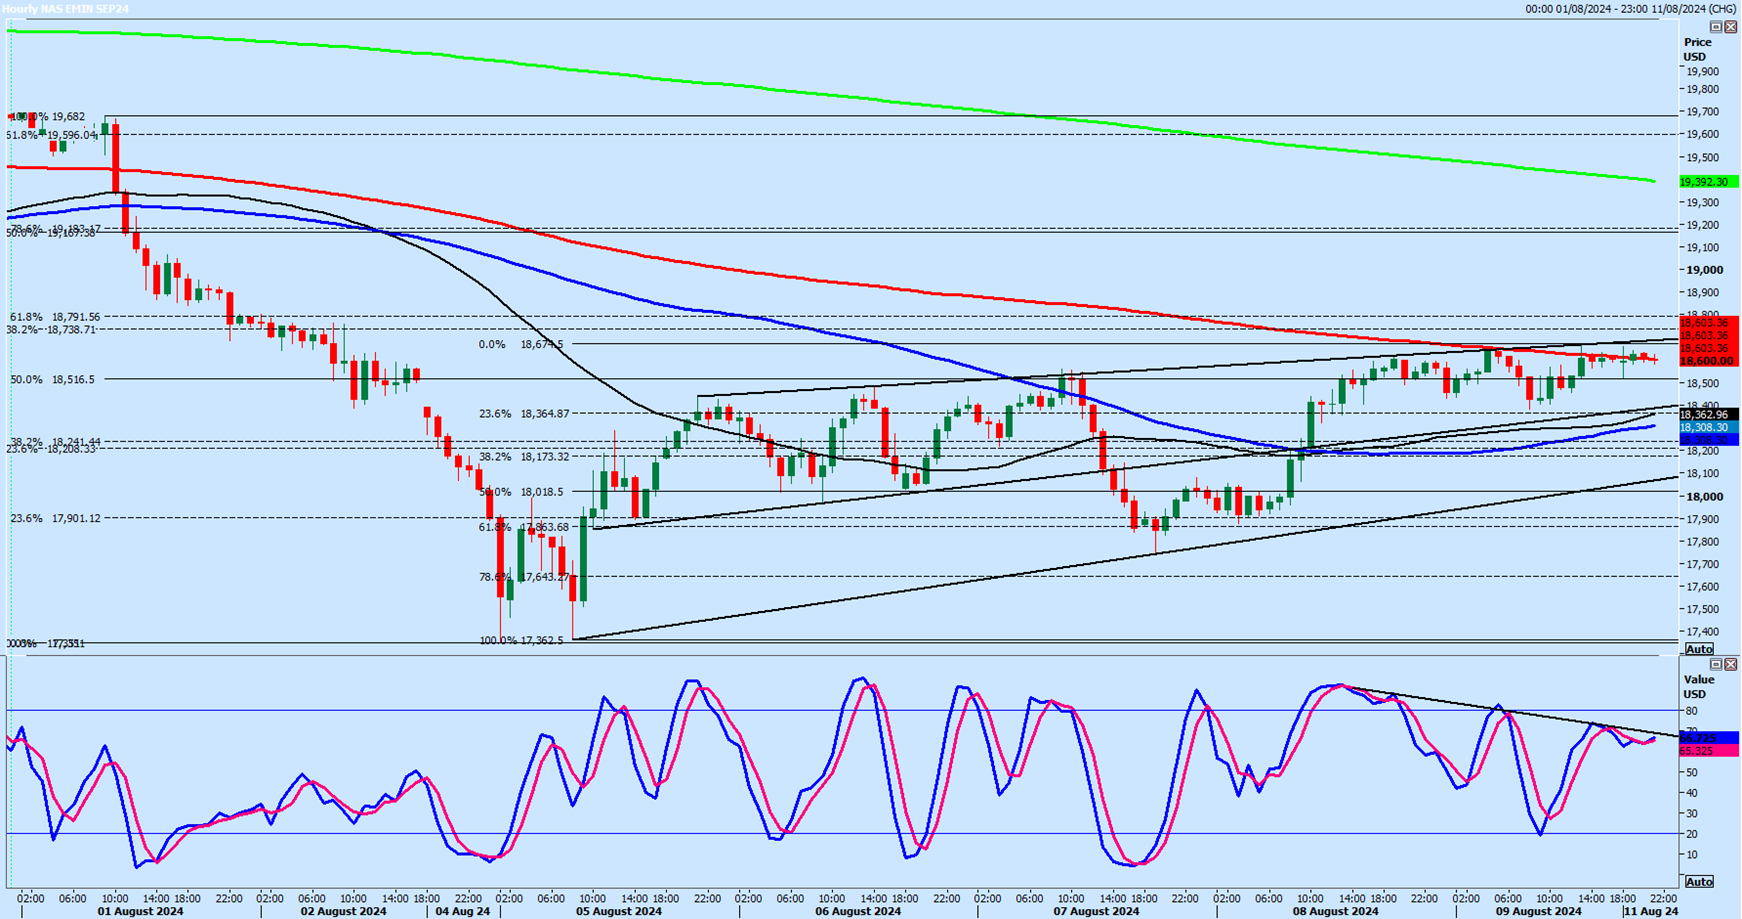
In the Nasdaq, I'm watching a potential bear flag formation within a consolidation channel. We’re approaching long-term resistance, marked by a two-year-old trendline and Fibonacci levels, suggesting that downside risks are significant.
My bias leans bearish for both the S&P and Nasdaq this week.
Emini S&P September futures
- Emini S&P retests strong resistance at 5350/5360 (US500 contract is about 26 points under this price) but rana as far as 5385 before reversing. I still think there is a good chance we turn lower on Monday. Targets: 5320, 5295, 5275 Abreak above 5385 is a buy signal targeting 5400 & resistance at 5420/30 for profit taking on longs & shorts need stops above 5440.
Nasdaq September futures
-
Emini Nasdaq hit resistance at 18630/730 (US100 contract is about 105 points above here) & made a high for the week exactly here.
-
Shorts need stops above 18850 & a break higher is a buy signal targeting 19000/19100 for profit taking on longs. Targets for the shorts at 18630/730 are 18480 & 18330, perhaps as far as 18200.
Author

Jason Sen
DayTradeIdeas.co.uk


