Gold and Gold Stock Indices

Investing in particular gold stocks gives exposure to movements in price of gold, but also to other factors affecting the gold mining industry, as well as company-specific strengths and weaknesses. This is why investors have to bear in mind the trends in the gold market as well as the mining industry, and wisely select appropriate stocks. One way to avoid the problem of selecting the promising shares (for instance for those that don’t have access to tools that would make the selection easier) is to invest in the index of gold mining companies.
There are several options available for investors, but the two most watched indices are: the NYSE Arca Gold BUGS (Basket of Unhedged Gold Stocks) Index (called the HUI Index) and Philadelphia Gold and Silver Index (called the XAU Index). The former is a modified equal dollar weighted index of 14 companies involved in gold mining which do not hedge their production beyond 1.5 years. It was developed in 1996 and is still traded on the NYSE. The XAU is a capitalization-weighted index of thirty precious metal mining companies that has been traded on the Philadelphia Stock Exchange since 1983. Another closely observed gold mining index is the NYSE Arca Gold Miners Index, which is a modified market capitalization weighted index comprised of precious metal mining companies. Its performance is tracked by the Market Vectors Gold Miners ETF, which – as an exchange-traded fund – is an interesting option for gaining exposure to gold miners.
There are three main differences between the HUI and XAU indexes. The former includes only gold miners who do not hedge their gold production beyond 18 months, while the latter consists of companies who use such hedging, and includes both gold and silver miners. Actually, the XAU Index also includes companies that mine other metals, such as copper, and for whom gold is only a byproduct. For example, Freeport McMoran is the largest component of the XAU Index (it makes up 8.45 percent of it), but its gold sales generate only 10 percent of the company’s revenues. Therefore, it seems that the XAU Index is a less reliable indicator of stocks’ sensitivity to movements in gold prices than the HUI Index.
Moreover, the indices attach different weights to particular companies. For example, the three largest companies constituting the HUI Index make up 40 percent of it, while the same companies amount to just 24 percent of the XAU Index. It means that the latter is more diversified and better reflects trends in medium-cup companies.
This is why there will be differences in indices’ performance. Indeed, as you can see in the chart below, although the two indices are positively correlated, the HUI Index is often slightly more sensitive to movements in gold prices than the XAU Index.
Chart 1: The price of gold (yellow line, left axis, London P.M. Fix), the HUI Index (green line, right axis), and the XAU Index (red line, right axis) from 1996 to 2016.
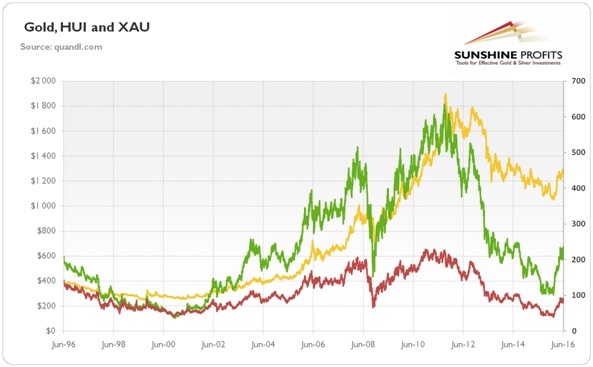
It makes perfect sense, as the HUI Index includes only gold miners and excludes companies using long-term hedging, reducing the sensitivity of bullion’s price volatility. For example, during the financial crisis in 2008, the HUI index collapsed by 70.6 percent, while the XAU Index plunged 68.2 percent. Given the fact that the price of bullion fell around 30 percent, the leverage offered by gold miners was higher than 2 in that period. Investors should always remember that leverage provided by gold stocks enables magnifying both gains and losses from the bullion market, as in our example. It also shows that gold behaved as a safe-haven asset when compared to mining stocks during the financial crisis, despite the initial price decline.
However, the conventional wisdom about the leverage offered by gold stocks does not hold in the long-term. As one can see in the chart 3, bullion outperformed both indices of gold mining companies in the long-run. The price of gold is now more than three times higher than in 1996, while the HUI Index is only 8.7 percent higher and the XAU Index actually lost almost 40 percent of its value in the last twenty years. It means that the gold mining equities performed relatively poorly compared to gold. Of special interest is the fact that their performance was also weak when compared to the general stock index, such as S&P 500, through that period.
Summing up, mining shares are correlated with the price of gold, but they should be viewed as a different asset class than bullion and related derivatives. Gold is insurance against market turmoil with no counterparty risk, while mining companies clearly have such exposures. Investors can limit the distinctive risks associated with particular mining businesses by investing in some indices of gold stocks. However, they do not track the price of gold accurately since they include companies producing other metals or the heavy hedging. The general stock market trends affect mining stocks in a different way than they do for gold. The mining stocks also behave distinctly during business cycles. Despite the conventional wisdom about the leverage offered by gold stocks, historical analysis shows that in the long-run bullion outperformed mining equities. It means that for long-term investors who would like to get full exposure to gold – especially for some insurance against black swan events – it makes sense to buy bullion, futures or ETFs rather than to invest in gold miners. Investors who want to invest in gold shares should consider active trading rather than adopting a “buy-and-hold” approach.
If you enjoyed the above analysis and would you like to know more about the gold stocks, we invite you to read the July Market Overview report. If you’re interested in the detailed price analysis and price projections with targets, we invite you to sign up for our Gold & Silver Trading Alerts. If you’re not ready to subscribe at this time, we invite you to sign up for our gold newsletter and stay up-to-date with our latest free articles. It's free and you can unsubscribe anytime.
Want free follow-ups to the above article and details not available to 99%+ investors? Sign up to our free newsletter today!
Author

Arkadiusz Sieroń
Sunshine Profits
Arkadiusz Sieroń received his Ph.D. in economics in 2016 (his doctoral thesis was about Cantillon effects), and has been an assistant professor at the Institute of Economic Sciences at the University of Wrocław since 2017.


