|

GE elliott wave view: Forecasting sellers at blue box area

In this technical blog, we are going to take a look at the past performance of GE 1-Hour Elliott wave Charts. That we presented to our members. In which, the decline from the 3/26/2020 peak is taking place as an ending diagonal structure in higher degree wave (5) with the sub-division of 3-3-3-3-3 structure in each lower. Also, the decline from that peak showed a lower sequence with a bearish sequence stamp called for more downside to take place. Therefore, our members knew that the sequence is incomplete. And selling the intraday bounce in 3 or 7 swings into the direction of the right side tag remained the preferred path. We will explain the Elliott wave structure & selling opportunity our members took below.

GE 1 Hour Elliott Wave Chart

GE

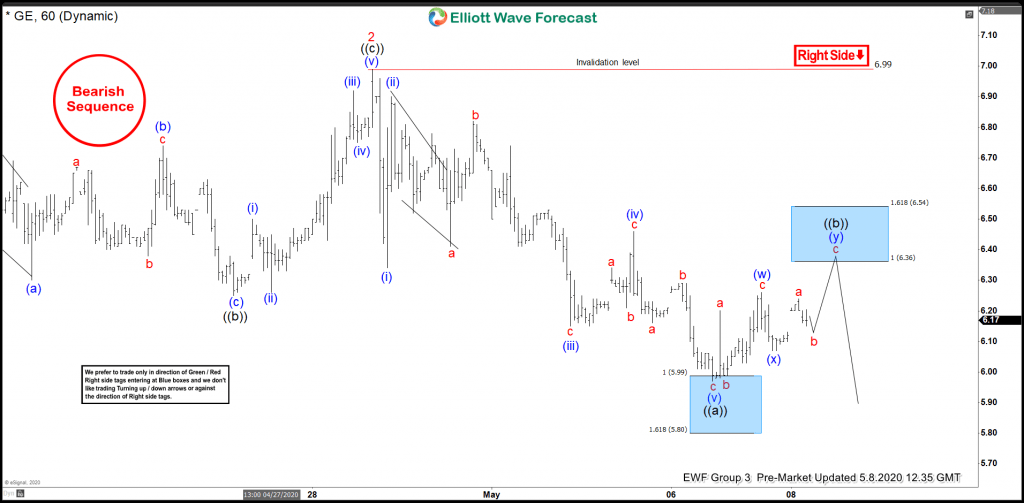
GE 1 Hour Elliott Wave Chart from 5/08/2020 Pre-Market update. In which, the bounce to $6.99 high ended wave 2 of a diagonal. Down from there, the decline in red wave 3 unfolded as a zigzag structure. Whereas wave ((a)) ended at $5.97 low. Wave ((b)) bounce was expected to find sellers at the blue box area at $6.36- $6.54 100%-161.8% Fibonacci extension area of (w)-(x). From there, the stock was expected to see sellers looking for the next extension lower or for 3 wave reaction lower at least.

GE 1 Hour Elliott Wave Chart

GE

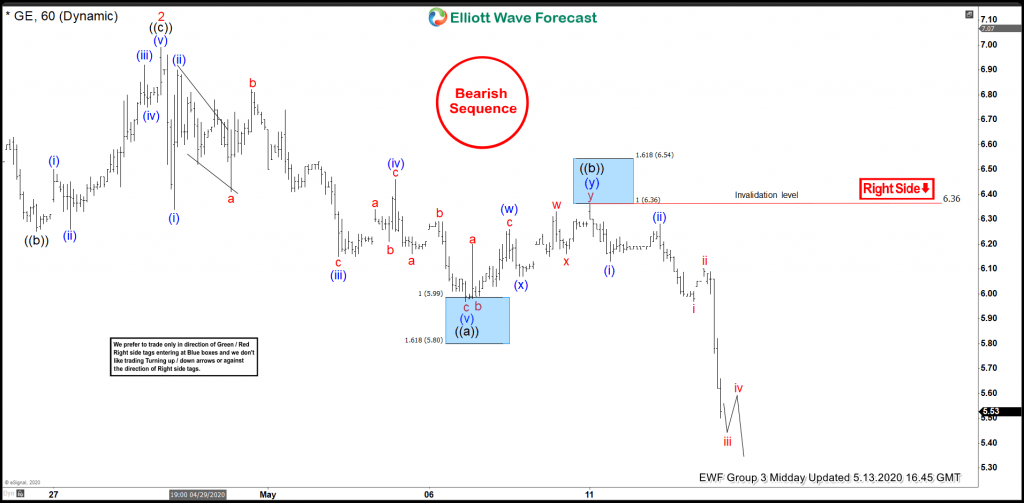
Here’s the 1 Hour Chart of GE from 5/13/2020 Midday update. Showing the reaction lower taking place from the blue box area at $6.36- $6.54. As we can clearly see that the stock was able to make new lows. Allowed members to create a risk-free position shortly after taking the short trade.

Author

Elliott Wave Forecast Team

Elliott Wave Forecast Team

ElliottWave-Forecast.com

More from Elliott Wave Forecast Team
Share:

Editor's Picks

EUR/USD holds near 1.1900 ahead of US data

EUR/USD struggles to build on Monday's gains and fluctuates near 1.1900 on Tuesday. Markets turn cautious, lifting the haven demand for the US Dollar ahead of the release of key US economic data, including Retail Sales and ADP Employment Change 4-week average.

GBP/USD declines toward 1.3650 on renewed USD strength

GBP/USD stays on the back foot and declines to the 1.3650 region on Tuesday. The negative shift seen in risk mood helps the US Dollar (USD) gather strength and makes it difficult for the pair to find a foothold. The immediate focus is now on the US Retail Sales data. 

Gold stabilizes above $5,000 ahead of US data

Gold enters a consolidation phase after posting strong gains on Monday but stays above the $5,000 psychological mark and the daily swing low. US Treasury bond yields continue to edge lower on news of Chinese regulators advising financial institutions to curb holdings of US Treasuries, helping XAU/USD hold its its ground.

Bitcoin Cash trades lower, risks dead-cat bounce amid bearish signals

Bitcoin Cash trades in the red below $522 at the time of writing on Tuesday, after multiple rejections at key resistance. BCH’s derivatives and on-chain indicators point to growing bearish sentiment and raise the risk of a dead-cat bounce toward lower support levels.

Dollar drops and stocks rally: The week of reckoning for US economic data

Following a sizeable move lower in US technology Stocks last week, we have witnessed a meaningful recovery unfold. The USD Index is in a concerning position; the monthly price continues to hold the south channel support.

Bitcoin Cash trades lower, risks dead-cat bounce amid bearish signals

Bitcoin Cash (BCH) trades in the red below $522 at the time of writing on Tuesday, after multiple rejections at key resistance. BCH’s derivatives and on-chain indicators point to growing bearish sentiment and raise the risk of a dead-cat bounce toward lower support levels.