GBPUSD – Ending Wedge highlights a bullish bias
Technical
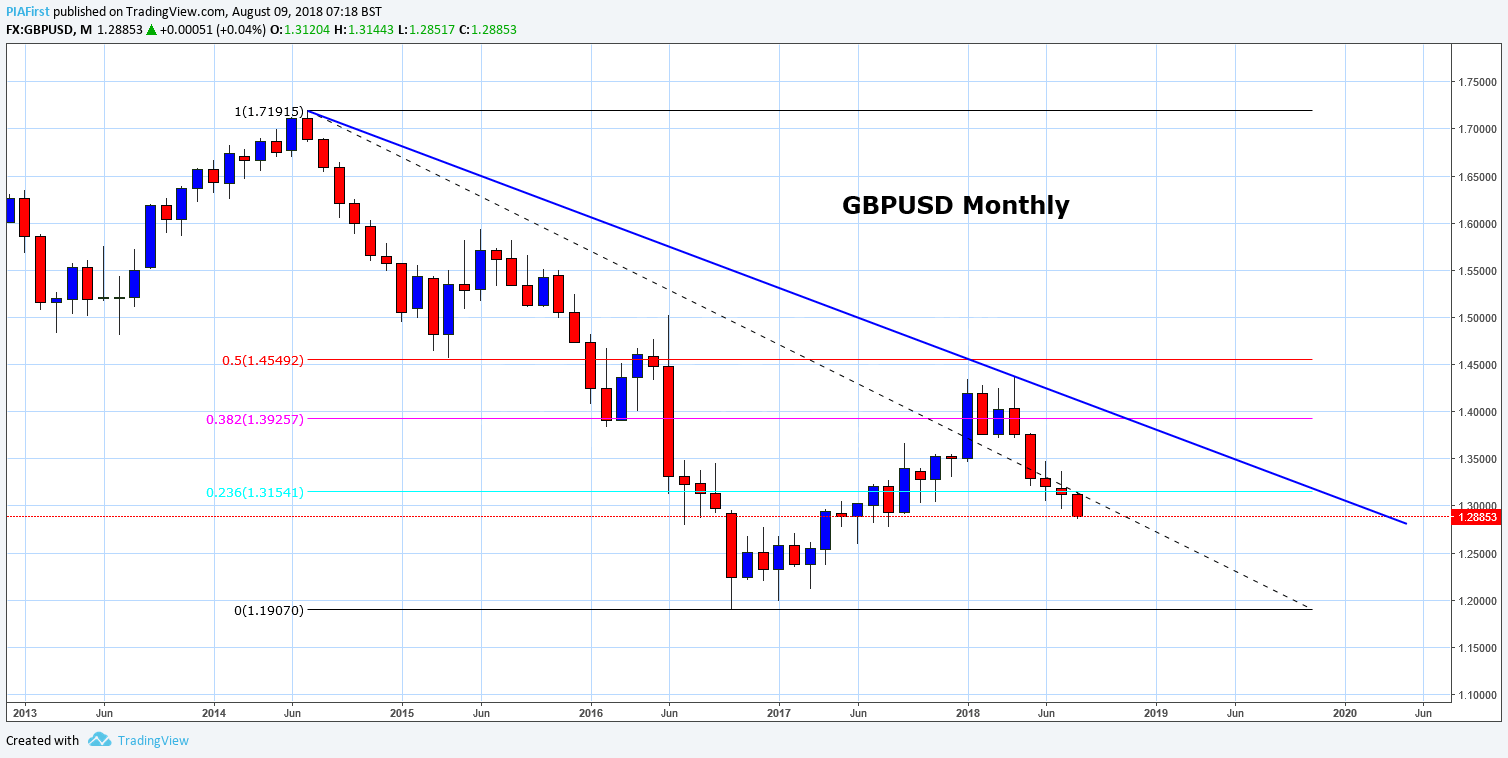
Monthly: Moved higher from the 2016 low of 1.1905. Levels close to be bespoke resistance at 1.4390 found sellers. Aprils price action formed bearish Outside Bar, often an indication that the rally (correction) has come to an end. Follow through selling pressure has resulted in GBPUSD trading to the lowest level in 11 months.
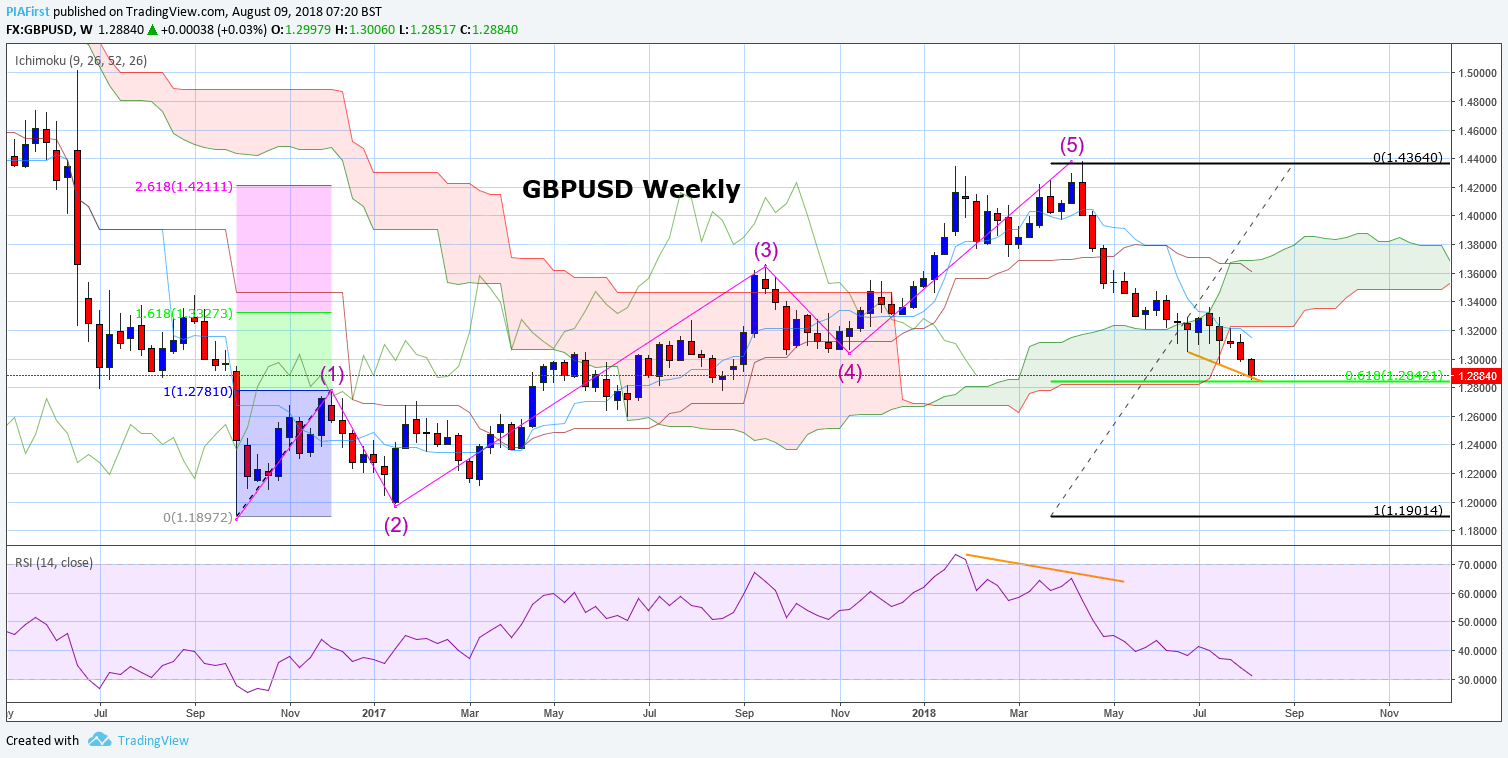
Weekly: After completing a bullish Elliott Wave pattern (5-waves) a bearish Outside Week was posted from the high (1.4377). Cable is now trading close to the 61.8% pullback level of 1.2842.
Daily: Mixed trading for the last 23 days. This has resulted in an Ending Wedge formation being posted. A break of 1.3100 and the measured move target is 1.3362. Bullish divergence can be seen on the daily chart (chart make lower lows while the RSI makes a higher low). Trend line support is located at 1.2842, the same level as the aforementioned Fibonacci support. We look to buy dips.
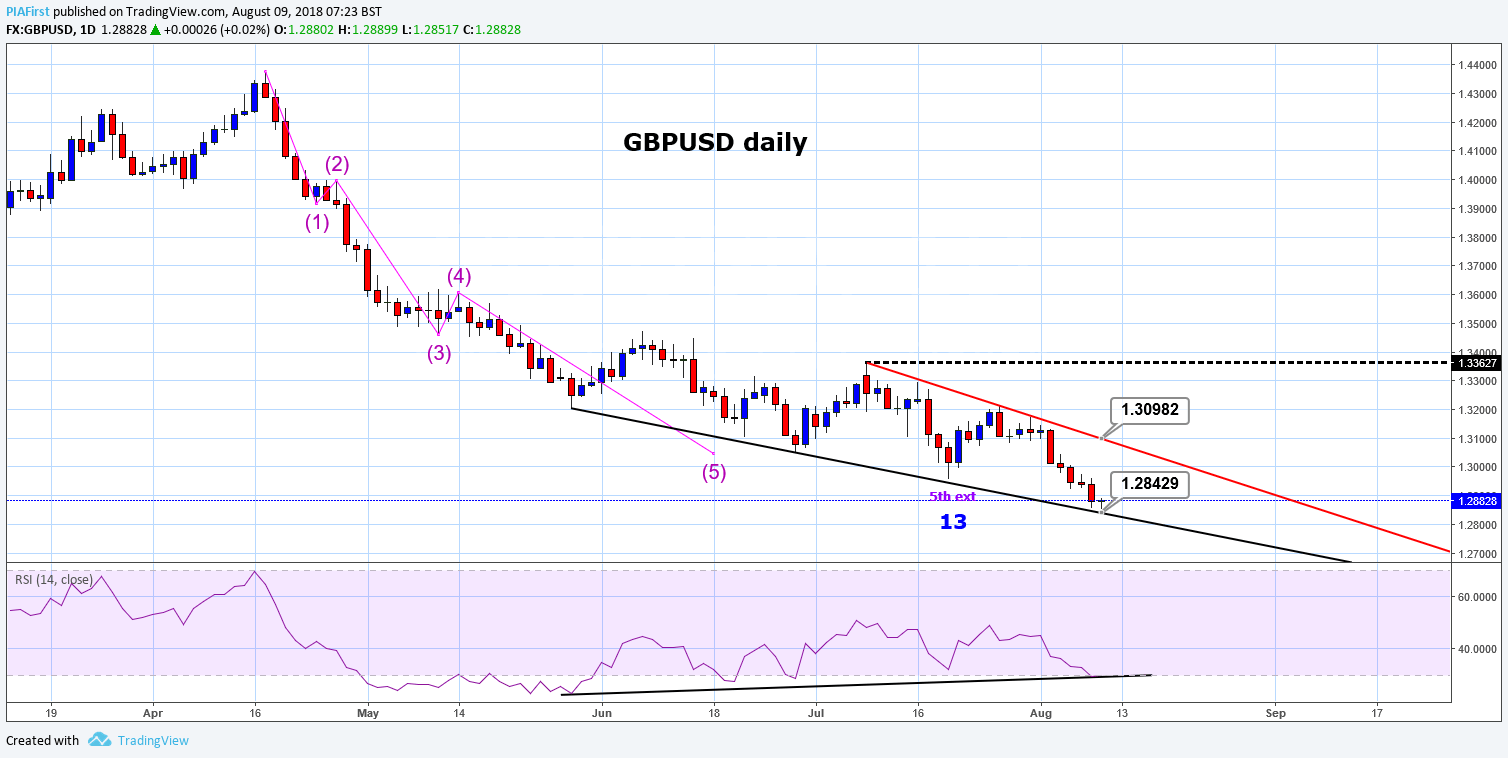
We look to Buy at 1.2850
Stop: 1.2750
Target: 1.3350
Article produced by Pia First for Orbex Limited
Visit PIA First for FX, Commodity & Stock Market trade ideas
Author

Ian Coleman
FXStreet
Ian started his financial career at the age of 18 working as a Junior Swiss Broker at Godsell Astley and Pearce (London). He quickly moved through the ranks and was Desk Manager at RP Martins at the age of 29.


