GBPUSD bounces off of R2 resistance
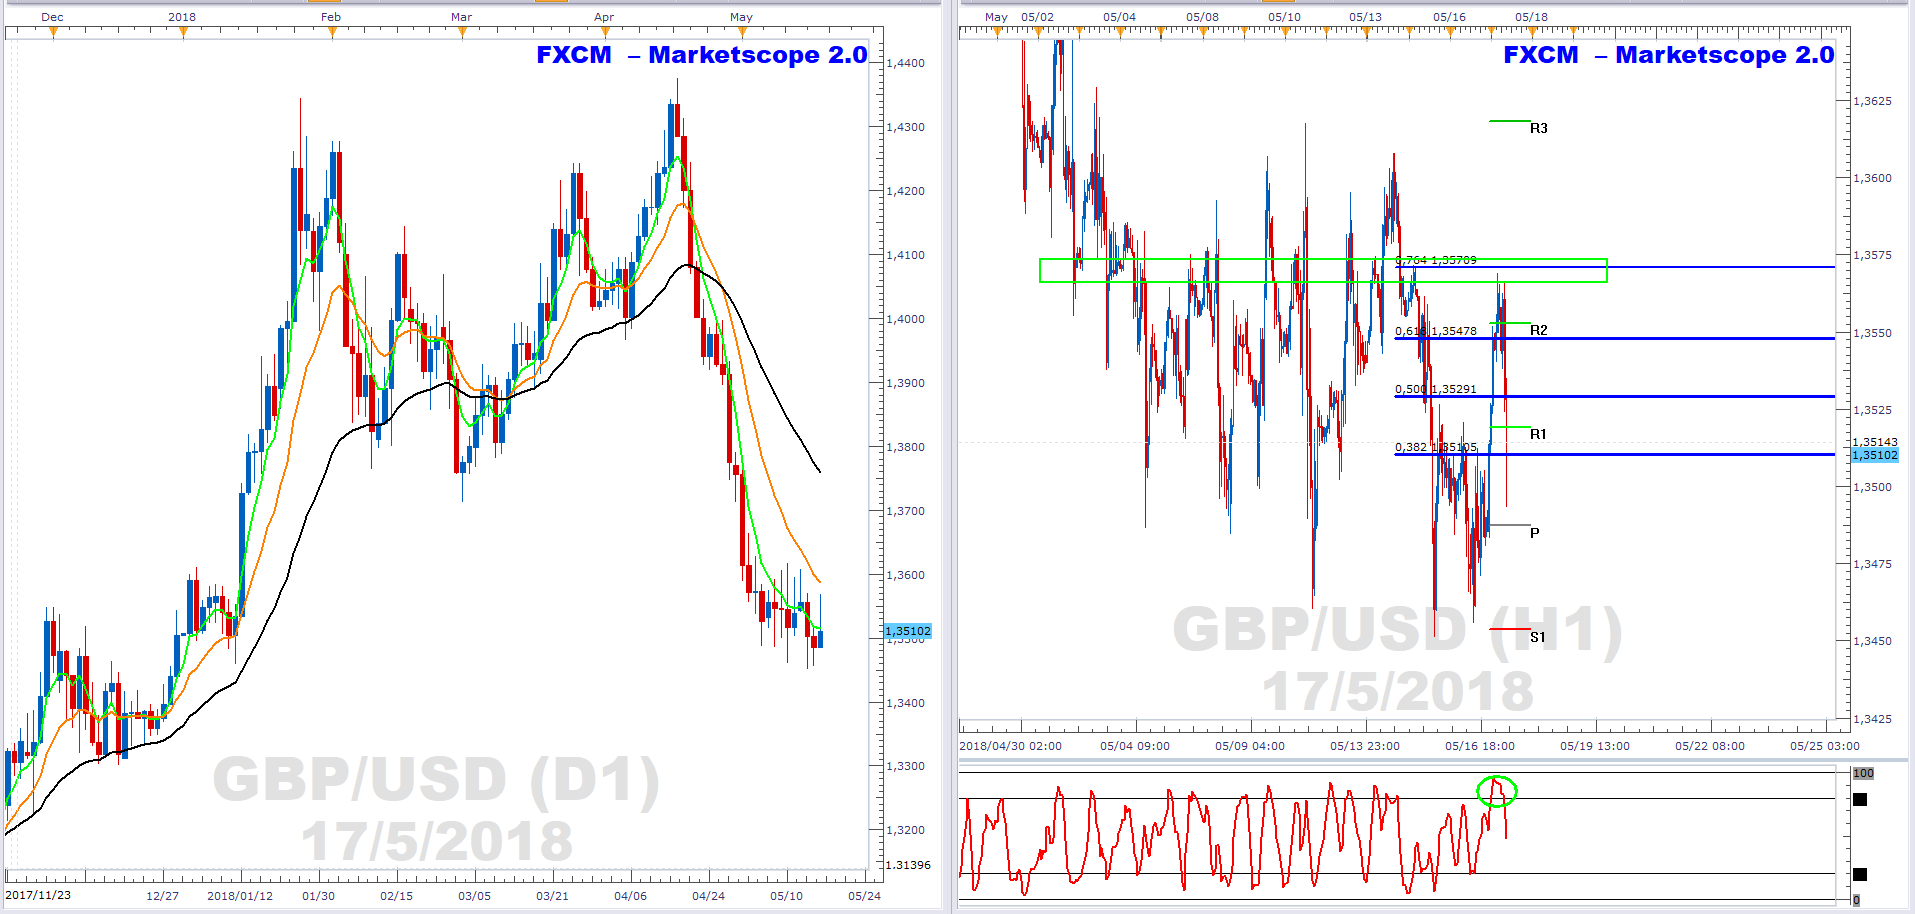
The left chart shows GBPUSD daily price action. As can be seen it is in mark-down phase This is characterised by a bearish EMA formation. I.e. The green 5-day EMA is below the orange 13-day EMA, and the orange 13-day EMA is below the black 34-day EMA.
The right chart shows hourly price action. Price found resistance at a key level with a confluence of factors including, price resistance (green rectangle), 76.4% Fibonaccian retracement, and an overbought stochastic (green ellipse).
There is still Brexit turmoil. The Scottish parliament voted by 93 to 30 to reject Theresa May’s Brexit bill.
Author

Russell Shor (MSTA, CFTe, MFTA) has an Honours Degree in Economics from the University of South Africa and holds the coveted Certified Financial Technician and Master of Financial Technical Analysis qualifications from the Interna


