GBP/JPY congested below 20-SMA, USD/CAD gives signs for more advances

Technical analysis – GBP/JPY congested below 20-SMA; bias neutral
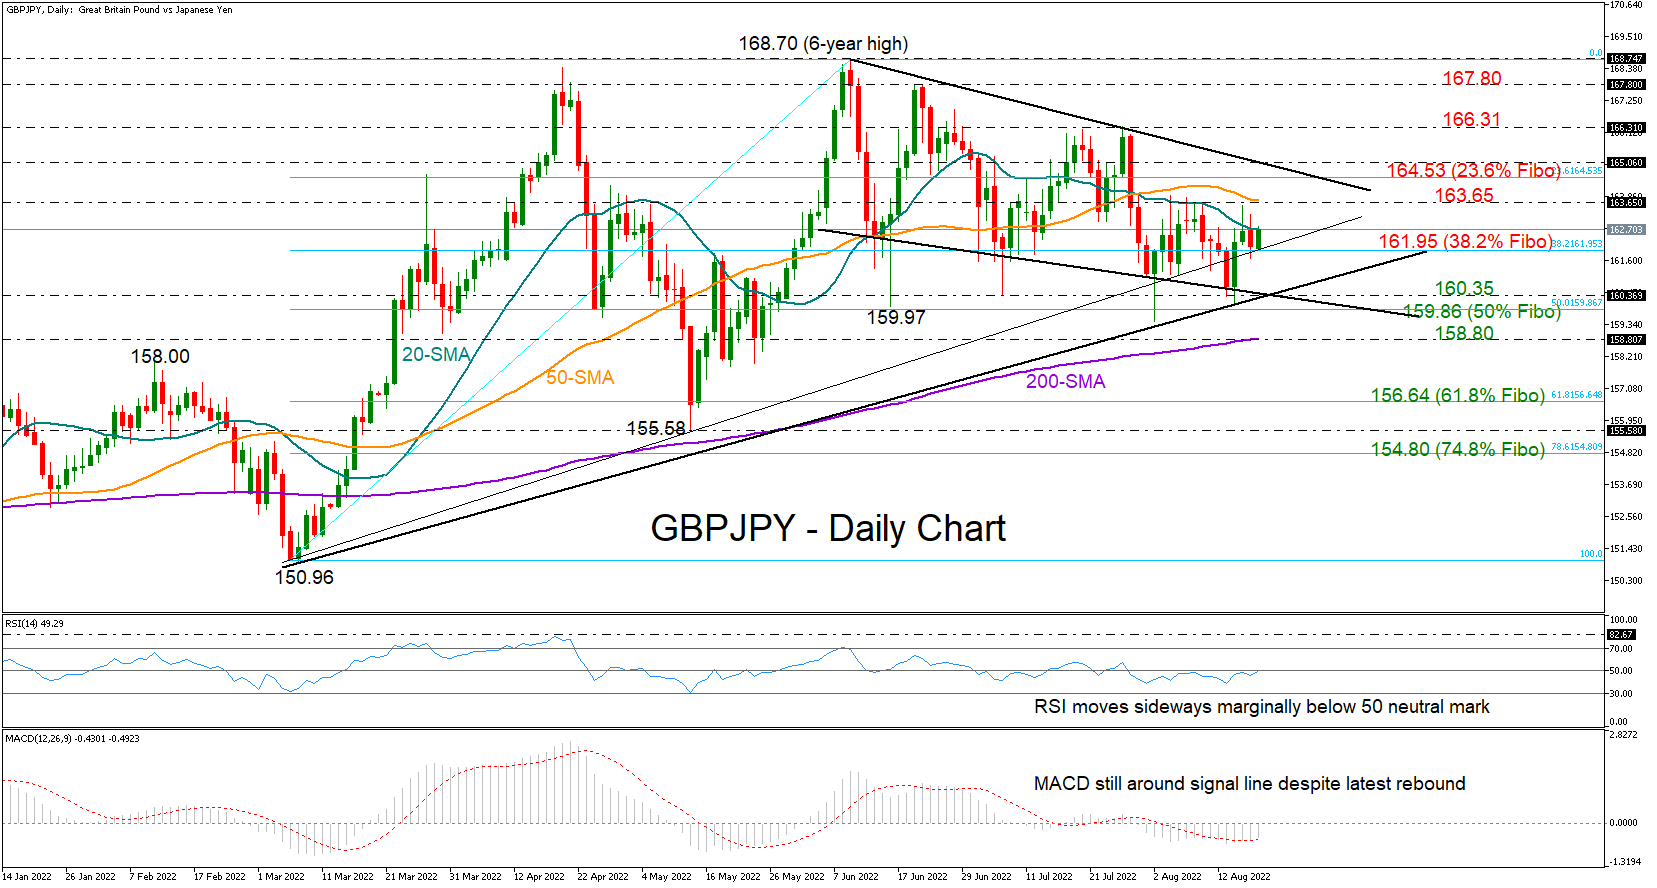
GBPJPY faced another rejection from the 20-day simple moving average (SMA) at 162.66 on Thursday, which has been capping bullish corrections since the start of the month, but the pullback was only mild, with the price immediately pausing around 161.95.
The momentum indicators remain cautious as the RSI keeps oscillating sideways marginally below its 50 neutral mark and the MACD has yet to distance itself above its red signal line. Having said that, as long as the safety net of 160.35 – 159.86 formed by two support lines and the 50% Fibonacci retracement of the 150.96 – 168.70 upleg holds, hopes for a new bull run are reasonable.
Should the pair close above the 20-day SMA, some consolidation could initially take place near the 50-day SMA at 163.65 before the door opens for the resistance line at 165.00. A sustainable move higher from here could then test the 166.31 barrier ahead of the 167.80 – 168.70 ceiling.
In the bearish scenario, where the price depreciates below 159.86, the 200-day SMA may first attract attention at 158.80. If the latter proves fragile, the decline may continue towards the key 61.8% Fibonacci of 156.64, a break of which could next take a breather somewhere between May’s low of 155.58 and the 78.6% Fibonacci of 154.80.
All in all, GBPJPY looks indecisive within the 162.66 – 161.95 territory at the moment. Any violation at the boundaries could navigate the market accordingly, though only a downfall below 159.86 or a rally above 165.00 would question the negative trend in the short-term picture.
USD/CAD gives signs for more advances; 1.2985 next pause
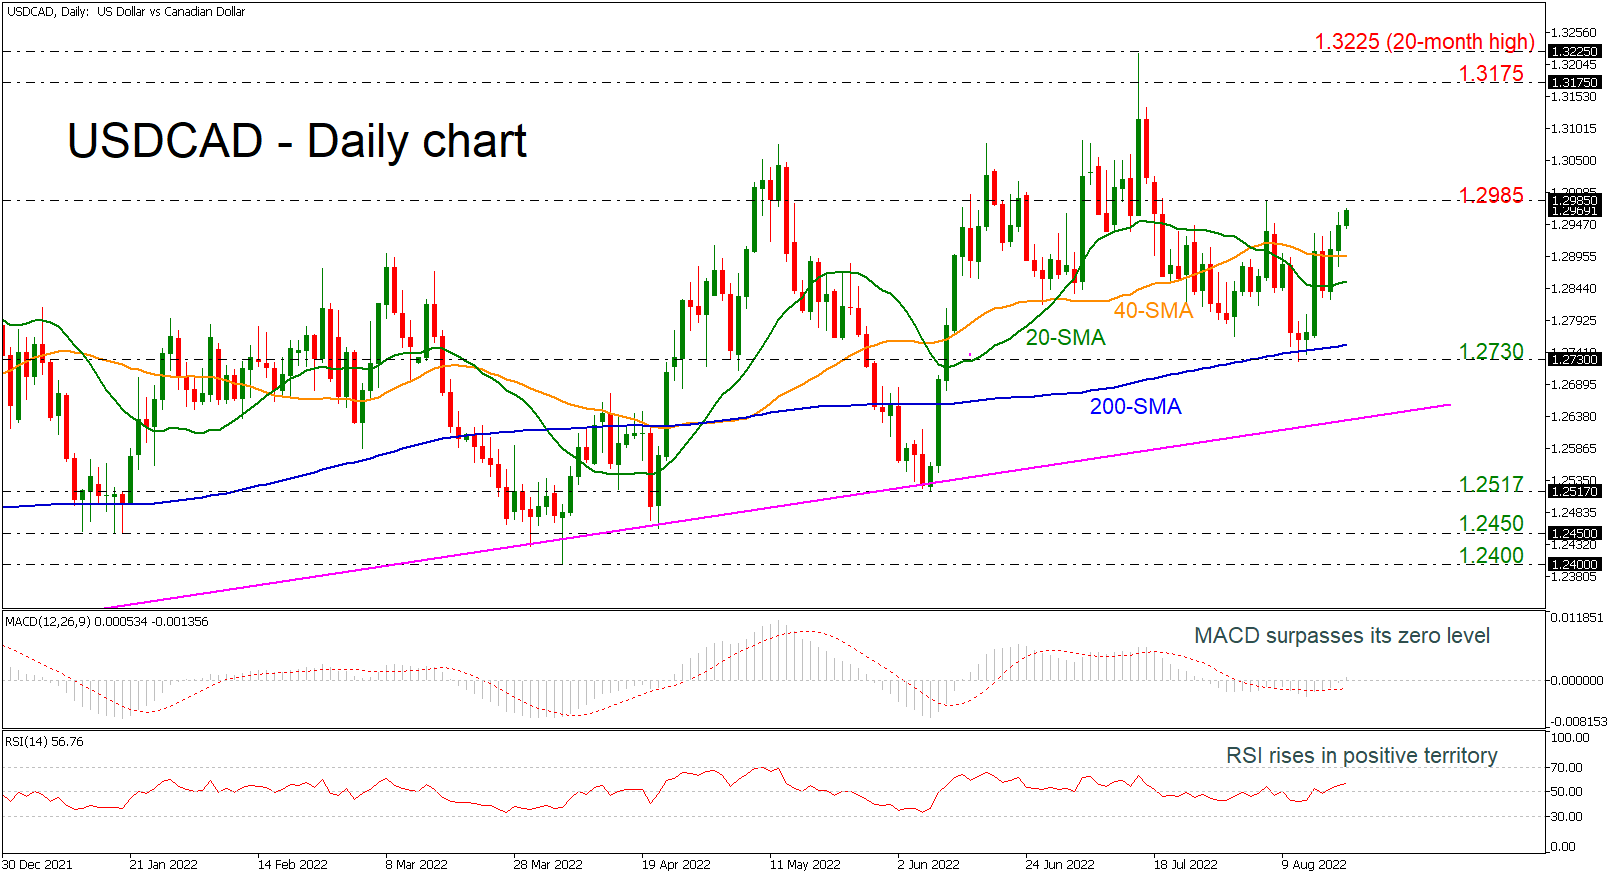
USDCAD is heading north above the short-term simple moving averages (SMAs) after a bounce off the 200-day SMA, which holds near the 1.2730 support level. In momentum indicators, the MACD is gaining ground above its trigger and zero lines, while the RSI has successfully surpassed its neutral threshold of 50 and is moving up.
Should the price close comfortably above the 1.2985 resistance, which has been unbreakable over the past month, traders could add more value to the pair, pushing the market up to 1.3175. More advances could lead the way for a retest of the 20-month peak of 1.3225.
In the negative scenario where the 40- and the 20-day SMA halts upside movements, the market could retest to the bottom of 1.2730. If this proves easy to overcome this time, the decline may next pause somewhere near the uptrend line at 1.2650, while even lower, investors could shift attention to the 1.2517 level.
In brief, USDCAD is in a bullish mode in the very short-term picture and any moves beyond 1.2985 could confirm the current positive bias.
Author

Christina joined the XM investment research department in May 2017. She holds a master degree in Economics and Business from the Erasmus University Rotterdam with a specialization in International economics.


