GBP/USD slide in the first 30 minutes of trade; critical resistance at 1.29190
GBP/USD slide in the first 30 minutes of trade; critical resistance at 1.29190
What's going on with the GBP vs USD?
GBP/USD: The Pound managed to achieve its long position target as per the last Friday15/2/2019 estimated from 1.28045 to 1.28725. The pair kicked off today's session with a price gap at 1.29032; however, it has slipped to 1.29000 in the 60 minutes price chart in the first 30 minutes of today's' opening trade and could continue down to 1.28725 support.
My thoughts on what may happen
GBP/USD: The Pound was tested around its 500 EMA in the 60 minutes price chart it today's opening session. The pair failed to continue to the upside at 1.29190 and slide. The pair still needs to break and hold above 1.29190 as indicated in my previous update to head back to the upside. A break below 1.28725 could push the pair down to 1.28428 and 1.28045
Support: 1.28725, 1.28428, and1.28045
Resistance:1.29190, 1.29818, and 1.30245
We explain market movements and its potential next move to help and guide you to possibly make the right decision on when to enter, apply stop losses to protect your capital, take profit and exit your position.
Chart 1: The short-term view of the GBP/USD price action in the 60 minutes price chart highlights the direction of the trend and the support and resistance price points.
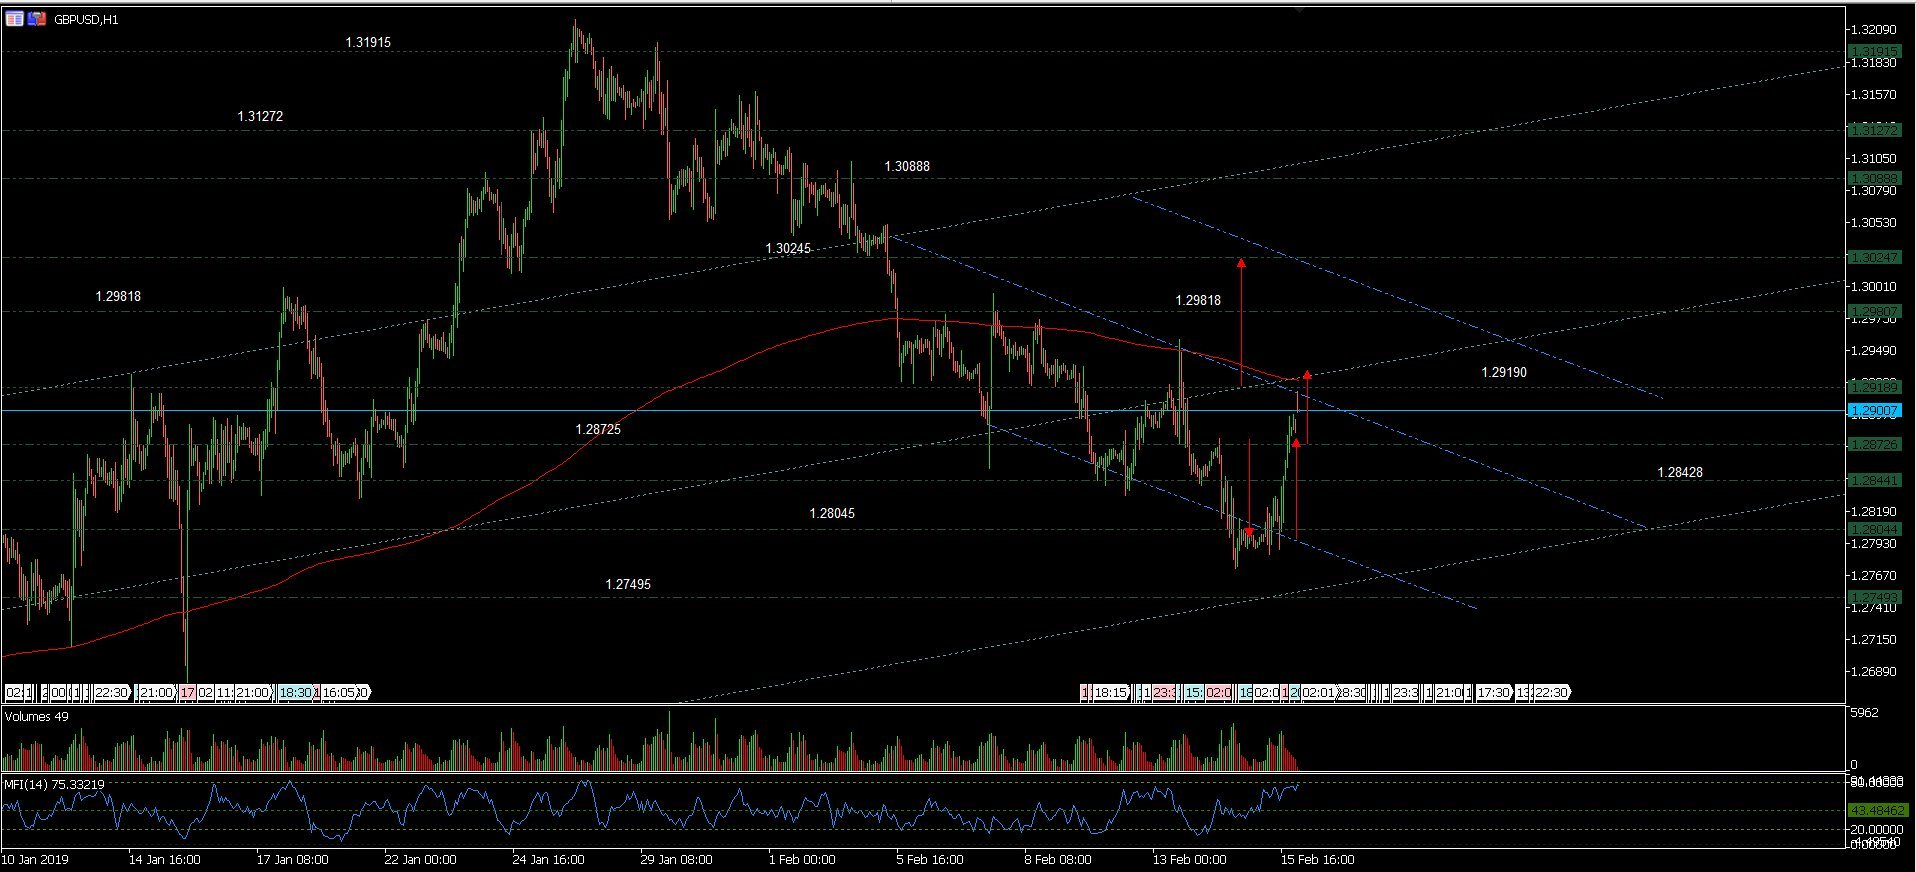
Chart 2: The short-term view of the GBP/USD price action in the four hours price chart highlights the direction of the trend and the support and resistance price points

Author

Denis Joeli Fatiaki
Independent Analyst
Denis Joeli Fatiaki possesses over a decade of extensive experience as a multi-asset trader and Market Strategist.


