GBP/USD sits on shaky ground after the Brexit delay — Confluence Detector

GBP/USD is off the lows after the European Union decided to grant the UK two more weeks to sort its business out and potentially leave by May 22nd if Parliament approves the accord. This advance places the pound above support, but this support is not that strong.
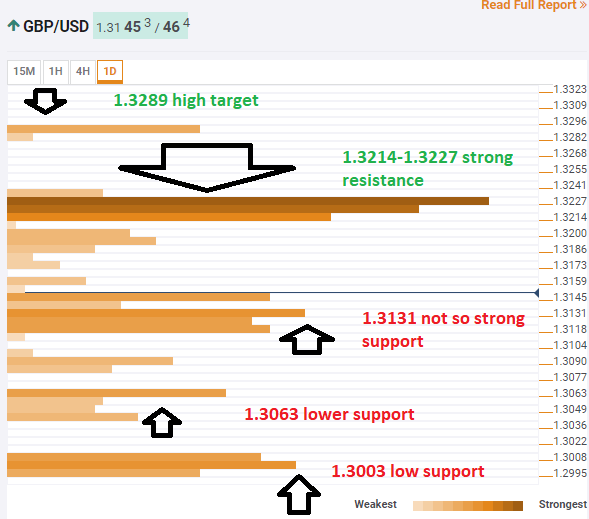
The Technical Confluences Indicator shows that cable has support around 1.3131 which is the convergence of the Simple Moving Average 100-15m, the SMA 10-1h, the Fibonacci 38.2% one-month, the Fibonacci 61.8% one-week, the SMA 5-4h, and the Bollinger Band 1h-Middle. These are not significant support lines.
If GBP/USD were to fall, the next cushion is at 1.3063 which is the confluence of the BB 1h-Lower, the SMA 50-1d, and the Fibonacci 23.6% one-day.
More substantial support awaits at 1.3003 where we see the Pivot Point one-day S1, the previous daily low, and the BB one-day converge.
Looking up, pound/dollar will face considerable resistance at the 1.3214 to 1.3227 region. We see a dense cluster including the BB 4h-Middle, the SMA 200-1h, the Fibonacci 23.6% one-month, the SMA 100-1h, the Fibonacci 38.2% one-week, the PP one-day R1, and the SMA 5-one-day.
Further above, 1.3289 is an upside target with the Fibonacci 38.2% standing out.
This is how it looks on the tool:
Confluence Detector
The Confluence Detector finds exciting opportunities using Technical Confluences. The TC is a tool to locate and point out those price levels where there is a congestion of indicators, moving averages, Fibonacci levels, Pivot Points, etc. Knowing where these congestion points are located is very useful for the trader, and can be used as a basis for different strategies.
This tool assigns a certain amount of “weight” to each indicator, and this “weight” can influence adjacents price levels. This means that one price level without any indicator or moving average but under the influence of two “strongly weighted” levels accumulate more resistance than their neighbors. In these cases, the tool signals resistance in apparently empty areas.
Author

Yohay Elam
FXStreet
Yohay is in Forex since 2008 when he founded Forex Crunch, a blog crafted in his free time that turned into a fully-fledged currency website later sold to Finixio.


