GBP/USD Price Forecast: Slightly oversold RSI warrants caution for bearish traders
- GBP/USD drifts lower for the fifth straight day and touches its lowest level since November 2023.
- Stagflation fears and UK fiscal concerns continue to weigh on the GBP amid a bullish US Dollar.
- The upbeat US jobs data reinforced hawkish Fed expectations and lifted the USD to a two-year top.

The GBP/USD pair attracts heavy selling for the fifth successive day and drops to its lowest level since November 2023, around the 1.2120 area at the start of a new trading week. The British Pound (GBP) has been underperforming in the wake of the risk of stagflation – a combination of high inflation and weak economic growth. Adding to this, a spike in the UK government bond yields since the launch of the Labour government’s debut budget plan in October has sparked widespread concern that the government could miss its own borrowing targets. This further contributes to denting sentiment surrounding the GBP, which, along with a bullish US Dollar (USD), continues to exert downward pressure on the currency pair.
In fact, the USD Index (DXY), which tracks the Greenback against a basket of currencies, stands firm near its highest level in over two years amid hawkish Federal Reserve (Fed) expectations. Investors now seem convinced that the US central bank will pause its rate-cutting cycle later this month and the bets were reaffirmed by the upbeat US monthly employment details released on Friday. The closely-watched Nonfarm Payrolls (NFP) report showed that the economy added 256K jobs in December, well above the previous month's downwardly revised reading of 212K and 160K anticipated. Furthermore, the Unemployment Rate edged down to 4.1% from 4.2% in November and the Average Hourly Earnings declined to 3.9% from 4.0%.
The prospects for slower rate cuts by the Fed, along with persistent geopolitical risks stemming from the Russia-Ukraine war and tensions in the Middle East, temper investors' appetite for riskier assets. This is evident from a weaker tone around the equity markets, which is seen as another factor underpinning the safe-haven buck. Meanwhile, UK rate futures point to about 44 basis points (bps) of Bank of England interest rate cut by the end of 2025 vs 50 bps on Friday. This, along with oversold conditions on the daily chart, assists the GBP/USD pair to recover a few pips from the daily swing low. The fundamental backdrop, however, suggests that any attempted recovery might still be seen as a selling opportunity and remain capped.
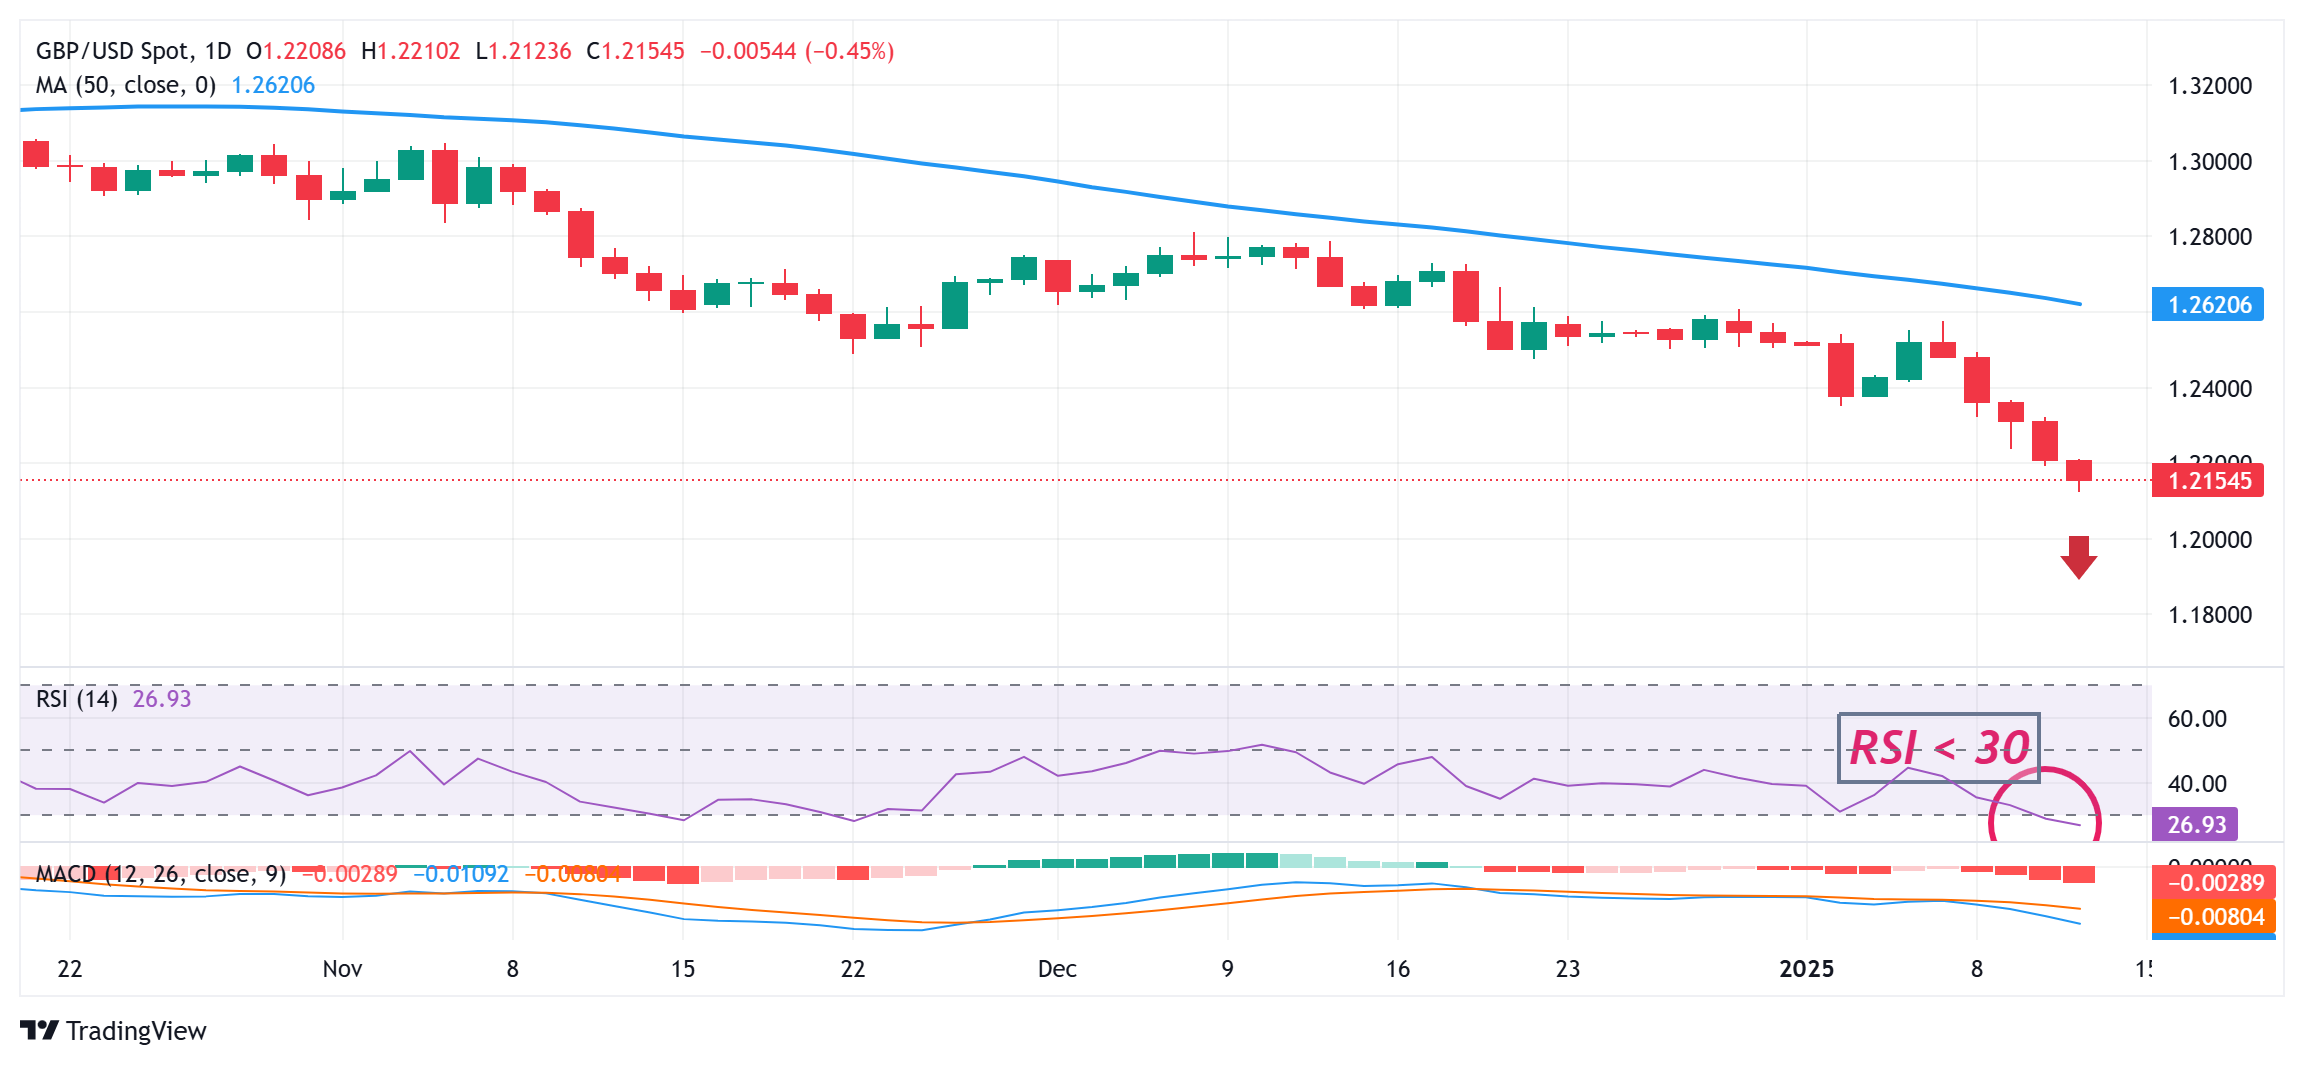
GBP/USD daily chart
Technical Outlook
From a technical perspective, last week's breakdown through the 1.2350 horizontal support was seen as a key trigger for bearish traders. A subsequent fall and acceptance below the 1.2200 mark supports prospects for deeper losses. That said, the Relative Strength Index (RSI) on the daily chart has dropped below the 30 mark. This makes it prudent to wait for some consolidation or a modest bounce before positioning for an extension over a three-month-old downtrend.
In the meantime, the 1.2200 mark now seems to act as an immediate hurdle. Some follow-through buying beyond the Asian session top, around the 1.2210 area, could trigger a short-covering move and lift the GBP/USD pair beyond the 1.2245-1.2250 intermediate hurdle, towards reclaiming the 1.2300 round figure. The latter should act as a key pivotal point, which if cleared would negate the negative bias and shift the near-term bias in favor of bullish traders.
On the flip side, weakness below the 1.2125-1.2120 area should pave the way for a slide towards testing sub-1.2100 levels, or the the November 2023 low. Acceptance below the said handle could make the GBP/USD pair vulnerable to decline further towards the October 2023 through, around the 1.2035 region, before eventually dropping to the 1.2000 psychological mark.
Premium
You have reached your limit of 3 free articles for this month.
Start your subscription and get access to all our original articles.
Author

Haresh Menghani
FXStreet
Haresh Menghani is a detail-oriented professional with 10+ years of extensive experience in analysing the global financial markets.


