|

GBP/USD picked the low-hanging fruit, but now faces tough resistance — Confluence Detector

GBP/USD kicked off the new trading week with a Sunday gap and is trading around 1.2900. Can it extend its gains? Not so fast. 

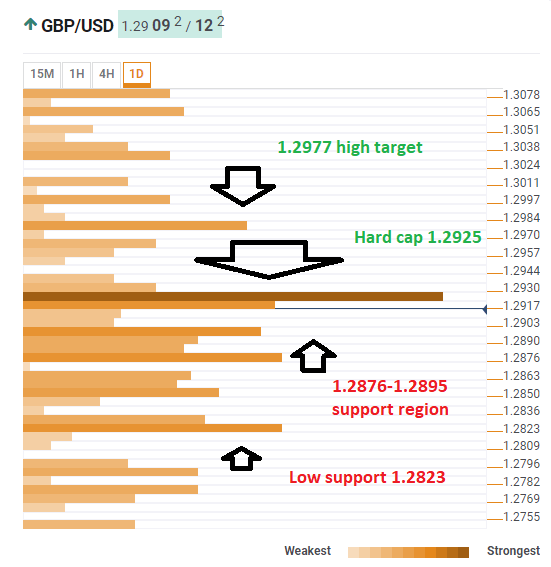
The Technical Confluences Indicator shows that cable faces a dense cluster of resistance lines at 1.2925, where we see the Fibonacci 38.2% one-month, the Simple Moving Average 200-4h, the Bollinger Band 15 minutes Upper, the SMA 5-15m, the SMA 10-1h, the SMA 10-1d, the SMA 10-15m, and the BB 15-minute Middle.

If the pair breaks to higher ground, the next cap is close. At 1.2977 we see the convergence of the Pivot Point one-day Resistance 2 and the PP one-week Resistance 1. 

Looking down, some support awaits at 1.2876-1.2895 area where we see the previous 4h low, at SMA 50-4h, the SMA 200-1h, the Fibonacci 23.6% one-day, the SMA 100-1d, and the BB 1h-Middle converge.

Further down, support awaits at 1.2823 which is the meeting point of the Fibonacci 23.6% one-week and the Pivot Point one-day Support 1. 

This is how it looks on the tool:

GBP USD technical confluence February 18 2019

Confluence Detector

The Confluence Detector finds exciting opportunities using Technical Confluences. The TC is a tool to locate and point out those price levels where there is a congestion of indicators, moving averages, Fibonacci levels, Pivot Points, etc. Knowing where these congestion points are located is very useful for the trader, and can be used as a basis for different strategies.

This tool assigns a certain amount of “weight” to each indicator, and this “weight” can influence adjacents price levels. This means that one price level without any indicator or moving average but under the influence of two “strongly weighted” levels accumulate more resistance than their neighbors. In these cases, the tool signals resistance in apparently empty areas.

Learn more about Technical Confluence

Author

Yohay Elam

Yohay Elam

FXStreet

Yohay is in Forex since 2008 when he founded Forex Crunch, a blog crafted in his free time that turned into a fully-fledged currency website later sold to Finixio.

More from Yohay Elam
Share:

Editor's Picks

EUR/USD recedes to daily lows near 1.1850

EUR/USD keeps its bearish momentum well in place, slipping back to the area of 1.1850 to hit daily lows on Monday. The pair’s continuation of the leg lower comes amid decent gains in the US Dollar in a context of scarce volatility and thin trade conditions due to the inactivity in the US markets.

GBP/USD resumes the downtrend, back to the low-1.3600s

GBP/USD rapidly leaves behind Friday’s decent advance, refocusing on the downside and retreating to the 1.3630 region at the beginning of the week. In the meantime, the British Pound is expected to remain under the microscope ahead of the release of the key UK labour market report on Tuesday.

Gold looks inconclusive around $5,000

Gold partially fades Friday’s strong recovery, orbiting around the key $5,000 region per troy ounce in a context of humble gains in the Greenback on Monday. Additing to the vacillating mood, trade conditions remain thin amid the observance of the Presidents Day holiday in the US.

Bitcoin consolidates as on-chain data show mixed signals

Bitcoin price has consolidated between $65,700 and $72,000 over the past nine days, with no clear directional bias. US-listed spot ETFs recorded a $359.91 million weekly outflow, marking the fourth consecutive week of withdrawals.

The week ahead: Key inflation readings and why the AI trade could be overdone

It is likely to be a quiet start to the week, with US markets closed on Monday for Presidents Day. European markets are higher across the board and gold is clinging to the $5,000 level after the tamer than expected CPI report in the US reduced haven flows to precious metals.

Monero Price Forecast: XMR risks a drop below $300 under mounting bearish pressure

Monero (XMR) starts the week under pressure, recording a 4% decline at press time on Monday after a 7% drop the previous day, putting the $300 support zone in focus.