GBP/USD nearing support, losing it opens the door to the 2018 lows — Confluence Detector

A new week, month, and quarter begins with the GBP/USD resuming its losses. What levels should we watch out for?
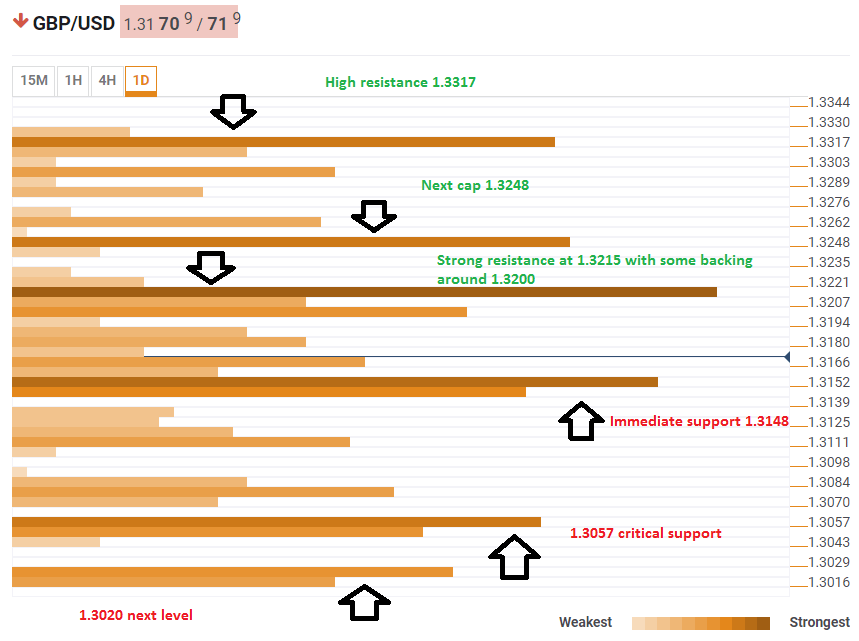
The Technical Confluences Indicator shows that the pair is nearing a strong support line at 1.3152. This is the convergence of the potent Fibonacci 23.6% one-month, the Simple Moving Average 10-4h, the Bolinger Band one-hour Lower (Stdv. 2.2), the Fibonacci 38.2% one-week, and the BB 1h-Middle.
If the pair loses that critical cushion, the next level to watch is 1.3057 which is the confluence of the one-month low and the one-week low as well as the Bolinger Band one-hour Lower. Before hitting 1.3000, there is one more notable support area at around 1.3020 which is the meeting point of the Pivot Points one-day Support 2 and the one-month Support 1.
On the topside, cable will find it hard to recover. 1.3215 is where the Fibonacci 38.2 one-month, the 4h-high, the one-day high, and the SMA 50=4h converge. There are additional lines of resistance at 1.3200 defending the region.
Further up, 1.3248 is notable for the Bollinger Band one-hour Upper. Much higher, 1.3317 is the confluence level of the Pivot Point one-day Resistance 2, the Fibonacci 61.8% one-month, and the SMA 200-4h.
The pair is trading within a range of many technical levels, but those on the top are stronger than those on the bottom.
This is how it looks on the tool:
Confluence Detector
The Confluence Detector finds exciting opportunities using Technical Confluences. The TC is a tool to locate and point out those price levels where there is a congestion of indicators, moving averages, Fibonacci levels, Pivot Points, etc. Knowing where these congestion points are located is very useful for the trader, and can be used as a basis for different strategies.
This tool assigns a certain amount of “weight” to each indicator, and this “weight” can influence adjacents price levels. This means that one price level without any indicator or moving average but under the influence of two “strongly weighted” levels accumulate more resistance than their neighbors. In these cases, the tool signals resistance in apparently empty areas.
Author

Yohay Elam
FXStreet
Yohay is in Forex since 2008 when he founded Forex Crunch, a blog crafted in his free time that turned into a fully-fledged currency website later sold to Finixio.


