GBP/USD Key Bullish Breakout Must Stay Above 1.39

Meta title: GBP/USD breaks above long-term resistance trend line
Meta description: GBP/USD is showing strong bullish momentum, which is typical for a wave 3. As long as the bearish retracement stays above the previous tops, the current wave pattern is probably a wave 4 and a bullish continuation is likely.
GBP/USD
4 hour
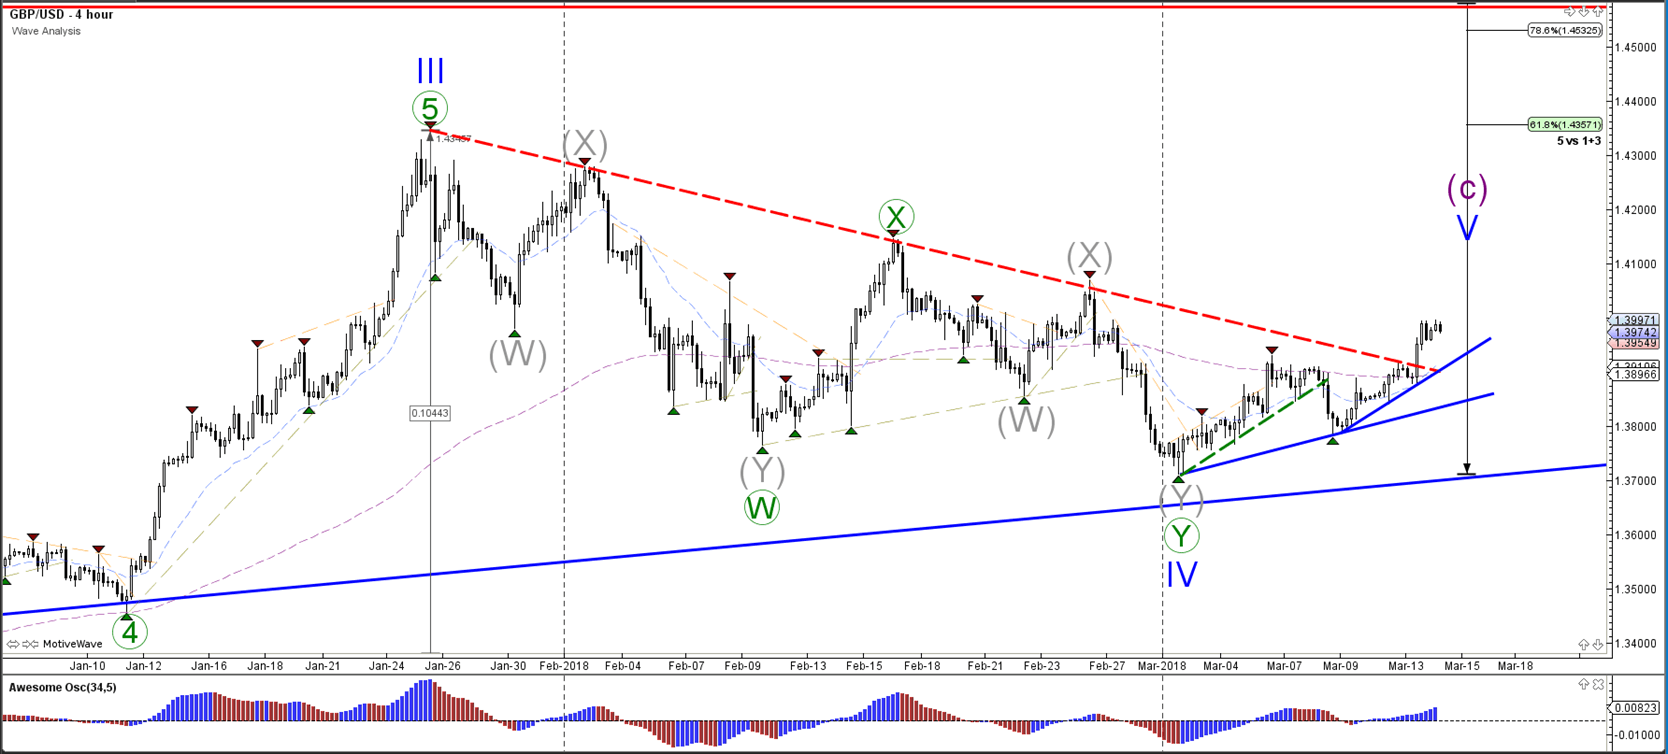
The GBP/USD has broken above the long-term resistance trend line (dotted red), which makes a bullish continuation likely within wave 5 (blue).Price will need to stay above the support trend lines (blue) otherwise the uptrend is in danger.
1 hour
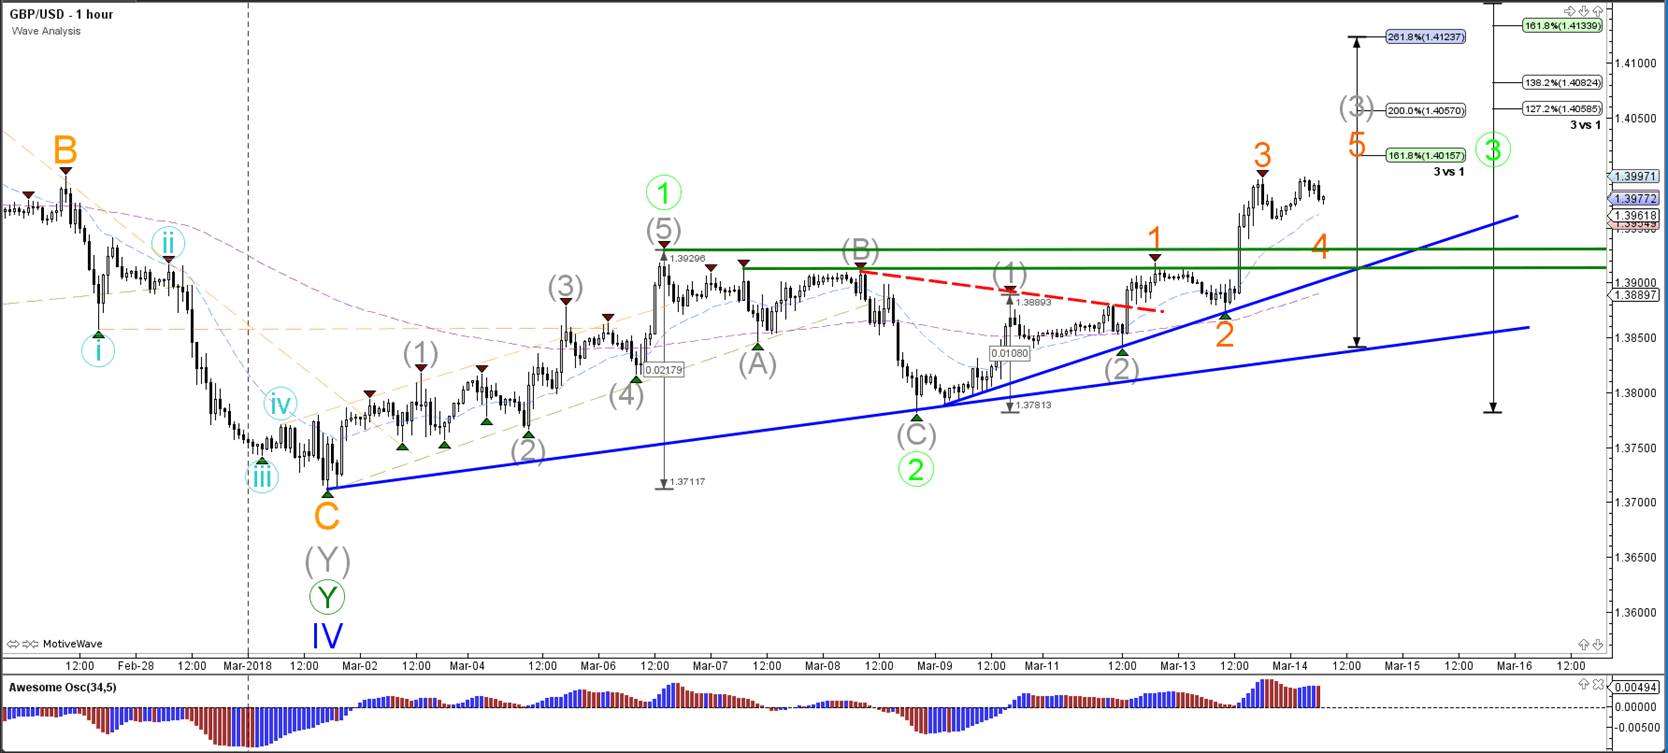
The GBP/USD is showing strong bullish momentum, which is typical for a wave 3 (orange). As long as the bearish retracement stays above the previous tops (green lines), the current wave pattern is probably a wave 4 (orange) and a bullish continuation is likely.
EUR/USD
4 hour
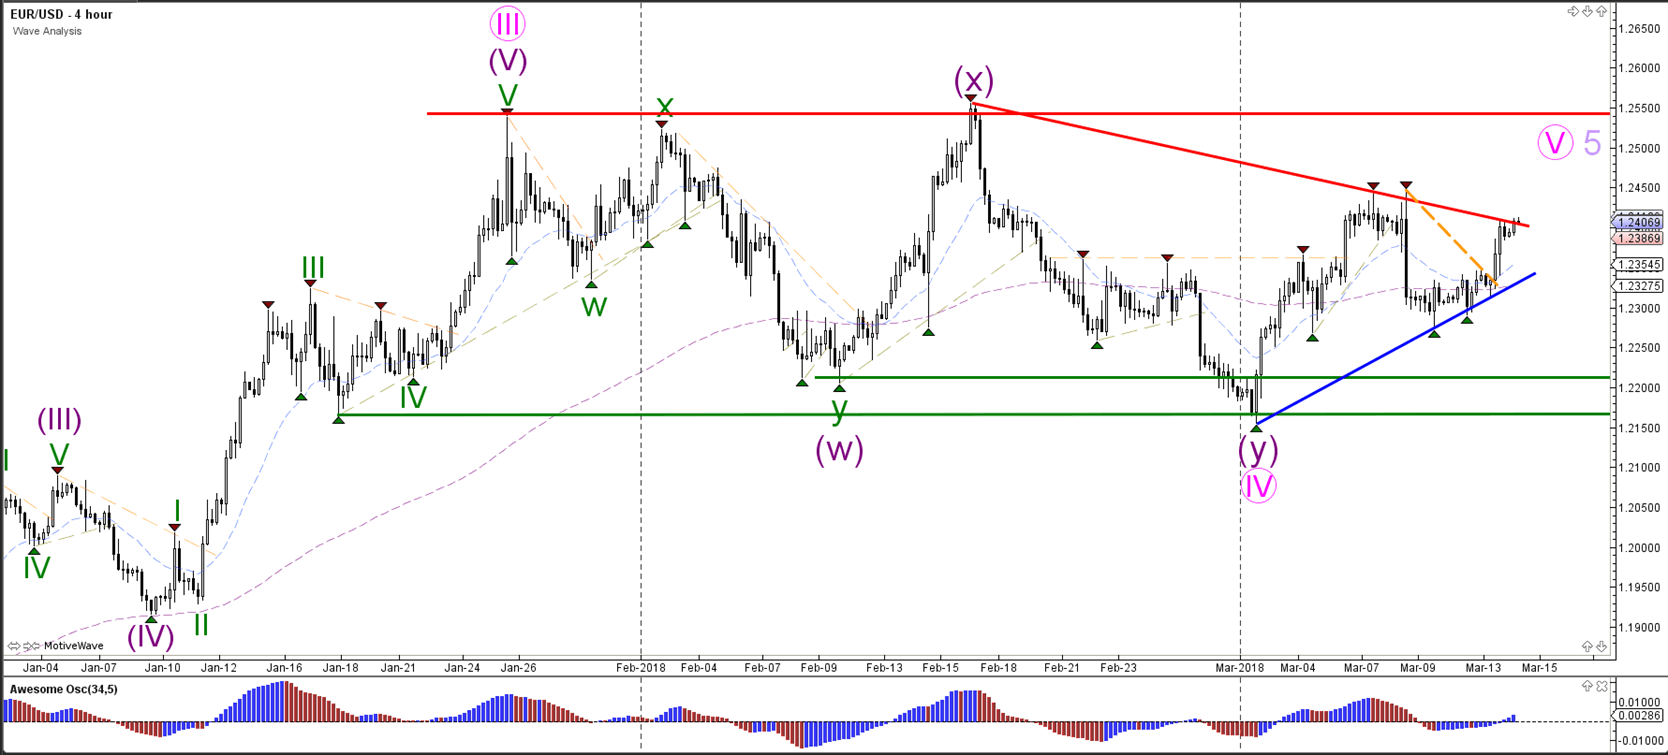
The EUR/USD is now testing the resistance trend line (red) of a triangle chart pattern. A bullish breakout could confirm the expected uptrend within waves 5 (pink/purple).
1 hour
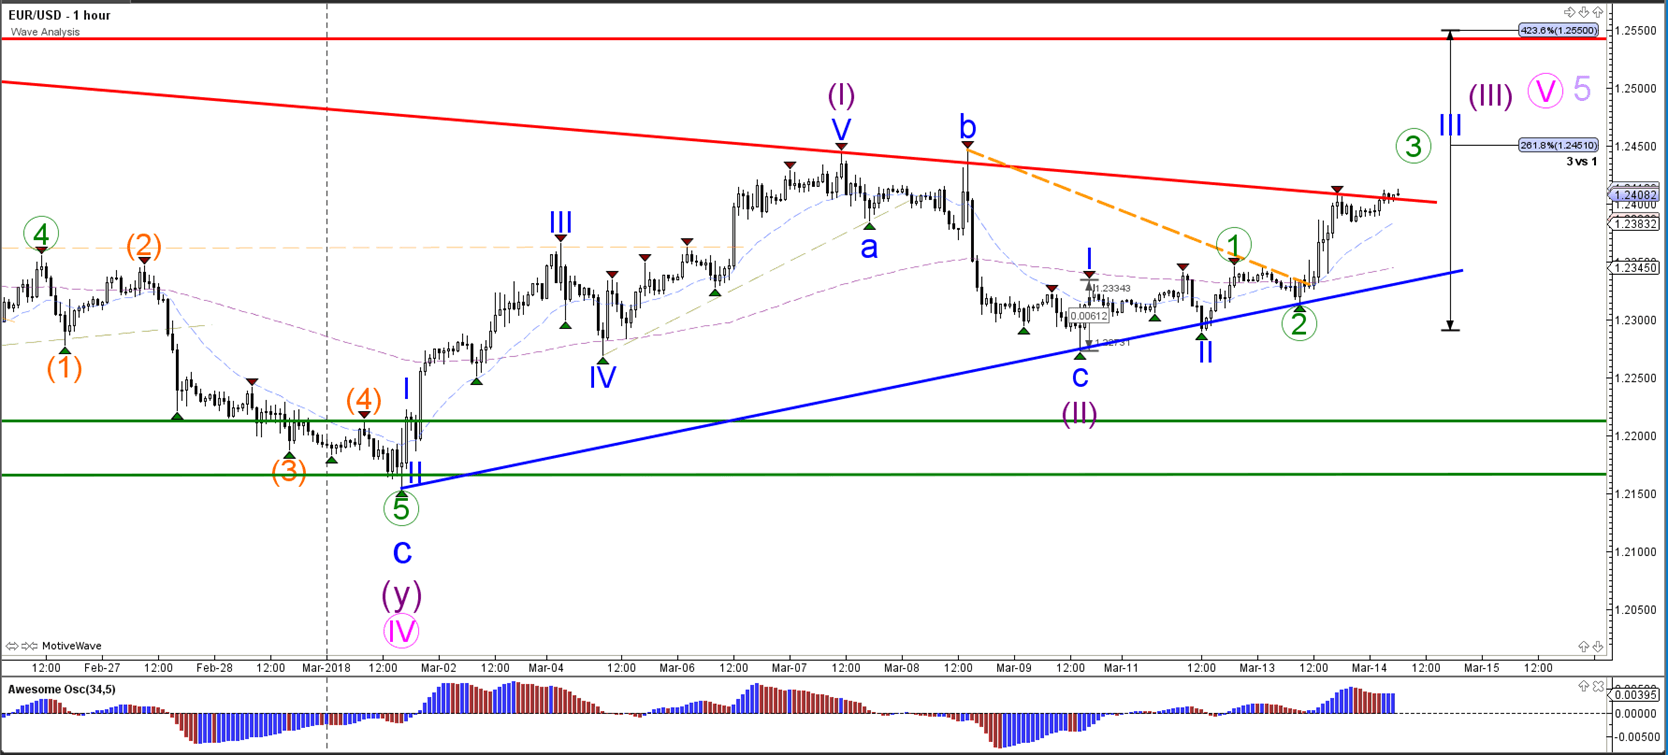
The EUR/USD bullish breakout above resistance (red) could start a potential wave 3 (green) of wave 3 (blue).
USD/JPY
4 hour
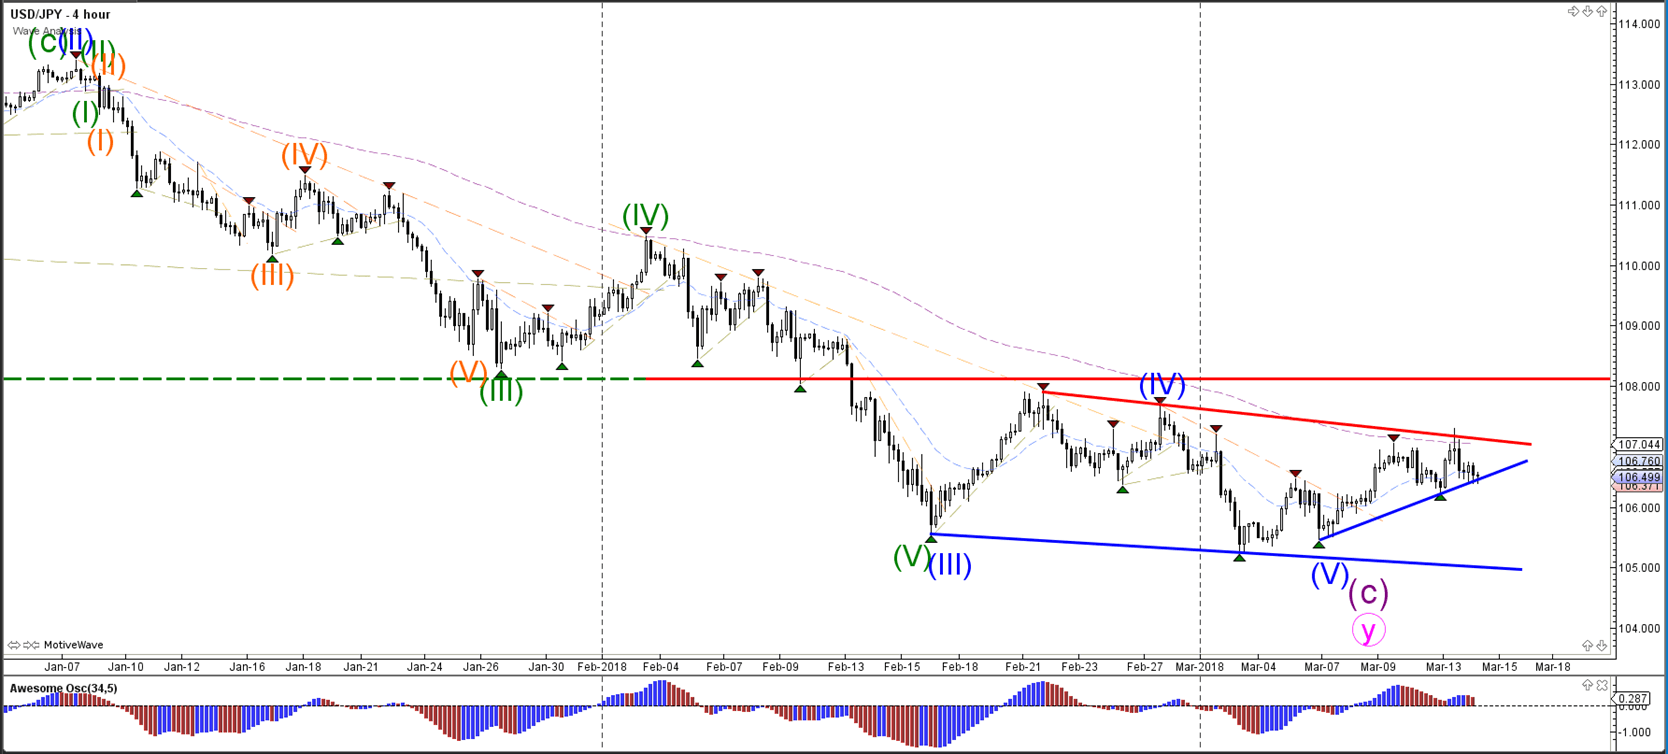
The USD/JPYcould be close to starting an uptrend but a breakout above the resistance is needed before that becomes more likely. A break below support (blue) could see price test the previous bottom.
1 hour

The USD/JPY could have completed a wave 5 (green) of wave 1 (blue) and is now building a potential bearish ABC (green) within wave 2 (blue).
Author

Chris Svorcik
Elite CurrenSea
Experience Chris Svorcik has co-founded Elite CurrenSea in 2014 together with Nenad Kerkez, aka Tarantula FX. Chris is a technical analyst, wave analyst, trader, writer, educator, webinar speaker, and seminar speaker of the financial markets.


