GBP/USD Forecast: Technicals fail to provide a directional clue
- GBP/USD has declined below 1.2400 following Thursday's mixed action.
- Pound Sterling holds above key support levels but buyers remain hesitant.
- PCE inflation in the US is expected to edge lower in December.

GBP/USD has lost its traction and declined below 1.2400 early Friday. As markets await the December Personal Consumption Expenditures (PCE) Price Index data from the US, the pair could stay in a consolidation phase amid mixed technical signals.
The stronger-than-expected fourth-quarter Gross Domestic Product (GDP) data from the US allowed the US Dollar hold its ground against its rivals late Thursday. With Wall Street's main indexes extending the bullish rally, however, risk flows helped GBP/USD limits its losses.
Nevertheless, the cautious market mood in the European morning, as reflected by modest losses in the US stock index futures, makes it difficult for GBP/USD to gather bullish momentum.
The Core PCE Price Index, the Federal Reserve's (Fed) preferred gauge of inflation, is forecast to rise 0.3% on a monthly basis in December and the annual rate is expected to decline to 4.4% from 4.7% in November. Even if the data confirms further softening of price pressures in December, the US Dollar could manage to keep its footing. The CME Group FedWatch Tool suggests that two 25 basis points Fed rate hikes in February and March are nearly fully priced in. Considering the fact that PCE inflation is a lagging data, the market reaction is likely to remain short-lived.
On the flip side, an unexpected increase in the annual Core PCE inflation figure could trigger a rebound in the US Dollar Index and weigh on GBP/USD with markets readjusting their positions ahead of next week's FOMC meeting.
Meanwhile, Reuters reported that UK Treasury Secretary Jeremy Hunt will say on Friday that they will tackle the country's weak productivity growth by using post-Brexit finance reforms to drive more investment. Markets are unlikely to pay much attention to UK political developments unless they are about EU-UK Brexit negotiations.
GBP/USD Technical Analysis
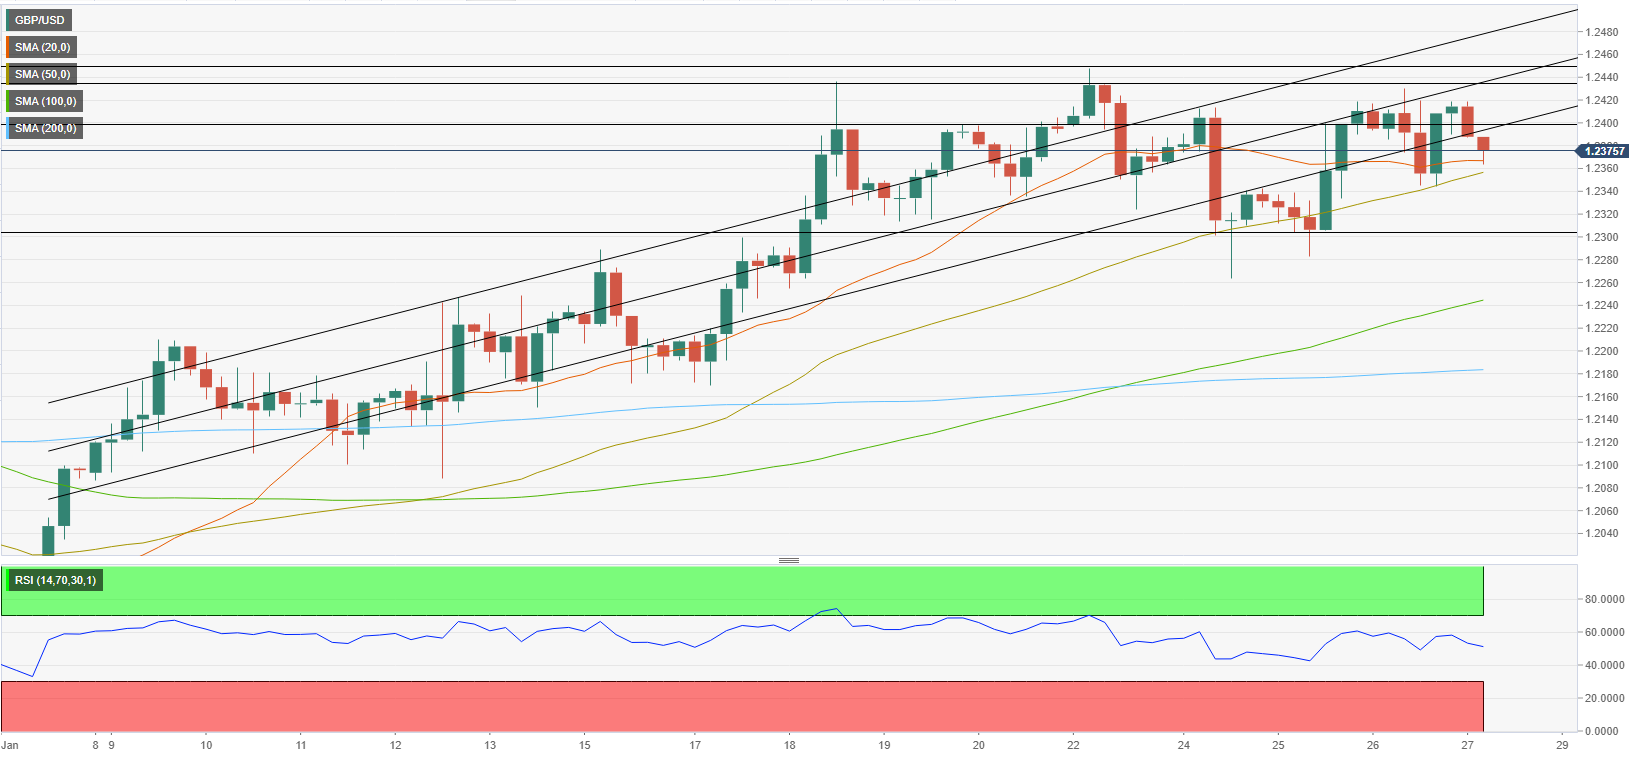
GBP/USD dropped below the ascending regression channel coming from early January but bears failed to drag the price below the 20-period Simple Moving Average on the four-hour chart. Additionally, the Relative Strength Index (RSI) indicator on the same chart holds near 50, reflecting the pair's indecisiveness.
In case GBP/USD makes a four-hour close below 1.2360, where the 20 and the 50-period SMAs align, it could extend its slide toward 1.2300 (psychological level, static level) and 1.2250 (100-period SMA).
On the upside, buyers could show interest if GBP/USD returns within the ascending channel by rising above 1.2400 and stabilizing there. In that case, additional gains toward 1.2430 (mid-point of the ascending channel, static level) and 1.2450 (static level) could be witnessed.
Author

Eren Sengezer
FXStreet
As an economist at heart, Eren Sengezer specializes in the assessment of the short-term and long-term impacts of macroeconomic data, central bank policies and political developments on financial assets.


