GBP/USD Forecast: Sterling hovers around key levels as Trump talks Dollar down
- GBP/USD is trading little changed on the downside at around key support level of 1.3000.
- Chances of Sterling breaking lower increased with core inflation decelerating and UK retail sales slumping lower and the outlook for the Bank of England hiking rates in August dimmed.
- The US President commenting on monetary policy of the Federal Reserve pulls US Dollar back.
Although it is not common for presidents to comment on the monetary policy and the central bank is an independent institution, for the US President Trump nothing is sacred enough to stop him from tweeting or commenting.
President Trump said overnight that while he is stimulating the economy with fiscal easing while the Federal Reserve is impeding growth by raising rates verbally pressing on looser monetary policy and a weaker dollar. The comment saw the US Dollar retreat from its highs across the board.
After falling past 1.3000 level the GBP/USD saw the low of 1.2955 on Thursday as the combination of decelerating core inflation and slumping retail sales in the UK clouded the outlook for the Bank of England hiking the Bank rate in August.
The GBP/USD consolidated around the key psychological level of 1.3000 after Trump’s verbal intervention but feels heavy going forward as it is trapped in the downward sloping channel.
With two weeks before the Bank of England monetary policy meeting coupled with the release of the August Inflation Report and followed by the press conference with Governor Mark Carney, the GBP/USD won’t face any important macro release and chances are of the Monetary Policy Committee remaining conservative in August even after its hawkish turn in June.
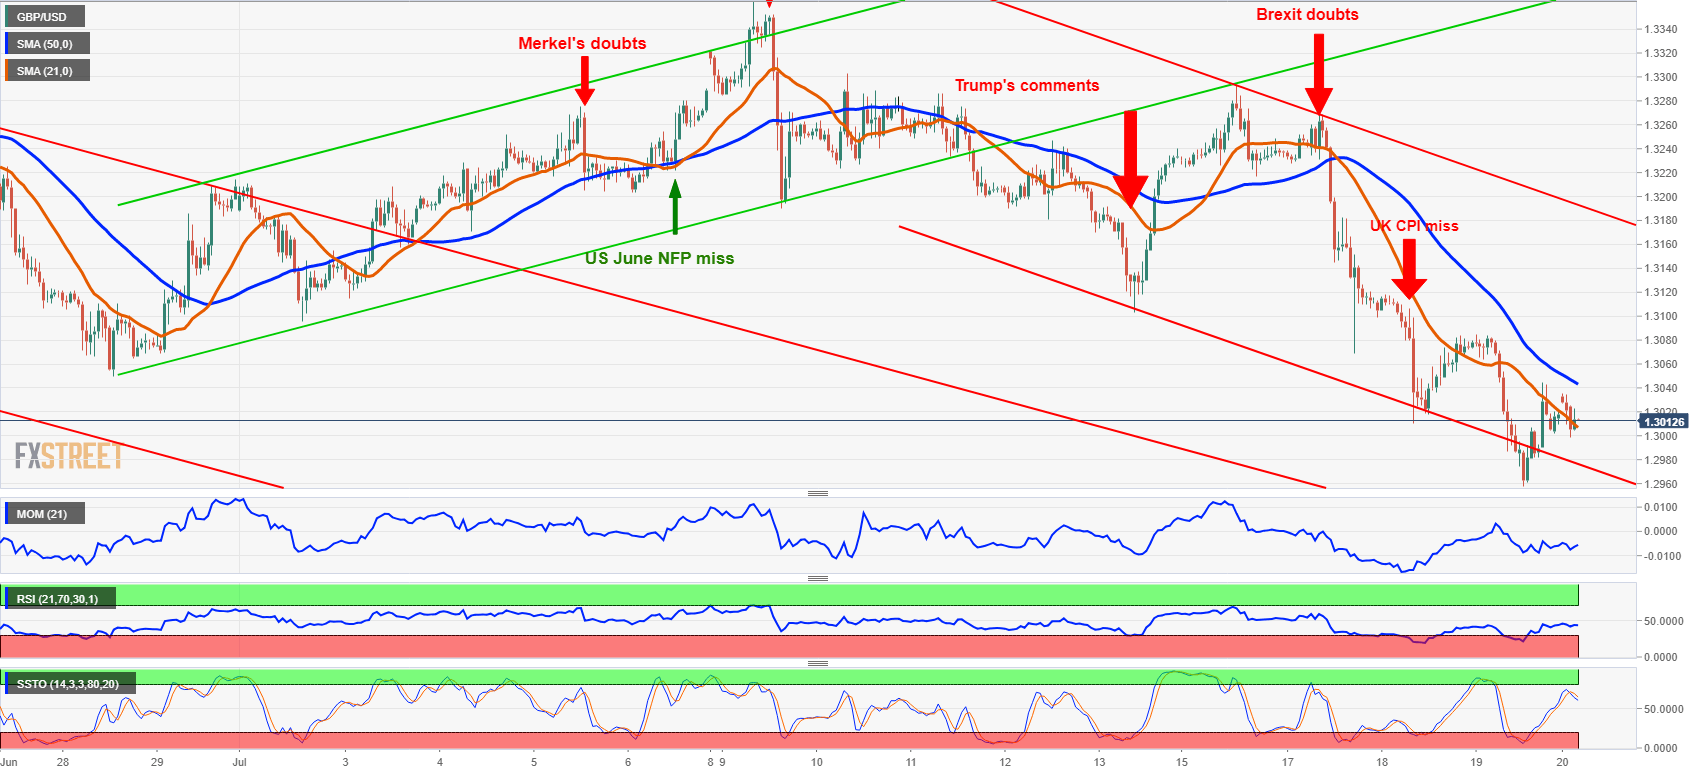
Technically, the oscillators turned lower on GBP/USD 1-hour chart with Momentum sliding lower and the Relative Strength Index escaping from the oversold territory. The sell signal is generated on Slow Stochastics, but the crossover is not in the overbought territory and that lowers the indication’s bar. The GBP/USD is still caped within the downward sloping channel with the next hurdle at around 1.2950 before testing round big figure of 1.2900.
GBP/USD 1-hour chart
Author

Mario Blascak, PhD
Independent Analyst
Dr. Mário Blaščák worked in professional finance and banking for 15 years before moving to journalism. While working for Austrian and German banks, he specialized in covering markets and macroeconomics.


