GBP/USD Forecast: Souring market mood could drag pound below 1.3560
- GBP/USD has encountered near-term resistance at 1.3600 early Thursday.
- Ukraine says Russian occupying forces fired on a village in Luhansk region.
- Additional losses are likely if GBP/USD falls below 1.3560 support.
GBP/USD has closed in the positive territory on Wednesday but lost its bullish momentum after testing 1.3600. Geopolitical headlines continue to drive the market action and the British pound faces a two-way risk amid the uncertainty surrounding the Russia-Ukraine conflict.
During the Asian trading hours, reports claiming that Ukraine has shelled separatists' positions in east Ukraine caused safe-haven flows to dominate the markets. Ukraine quickly denied these claims and the Ukrainian military recently reported that Russian occupying forces fired on a village in the Luhansk region.
Meanwhile, the west is yet to confirm a pullback of Russian forces despite the fact that the Russian defence ministry announced earlier in the day that 10 military convoys had left Crimea after finishing the drills.
Following these developments, the market mood sours with the UK's FTSE 100 Index losing 0.5% in the early European session. US stocks futures indexes are down between 0.5% and 0.6%, confirming the view that investors remain on edge while trying to figure out whether or not there will be a military conflict between Russia and Ukraine.
The US Department of Labor will release the weekly Initial Jobless Claims data later in the day, which is likely to be ignored by market participants.
A further escalation of geopolitical tensions could weigh on GBP/USD while a positive shift in risk sentiment could open the door for additional gains.
GBP/USD Technical Analysis
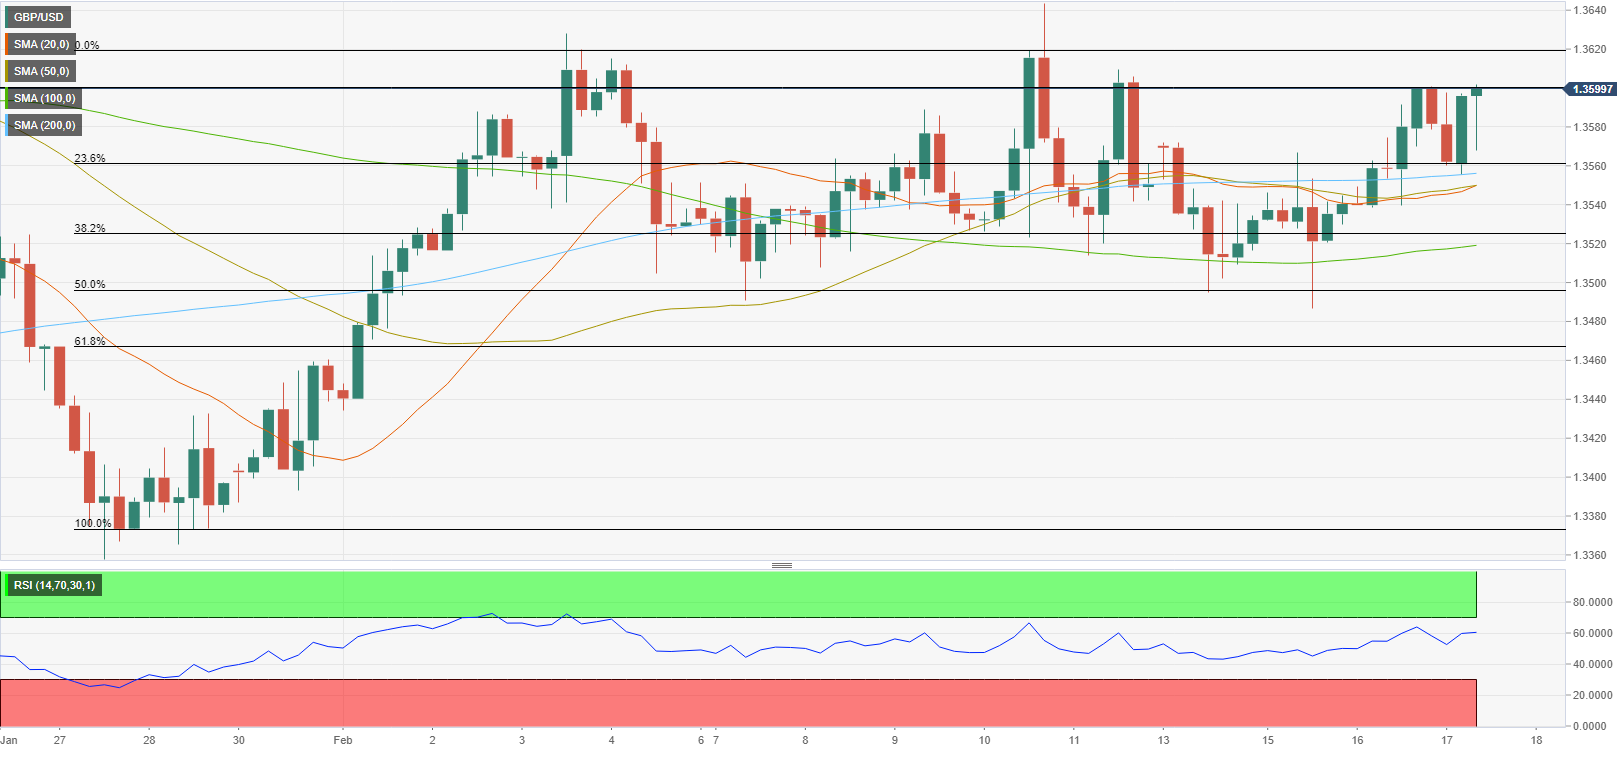
The pair continues to trade above the 200-period SMA on the four-hour chart and the Relative Strength Index (RSI) indicator is moving sideways near 60, suggesting that the near-term bullish bias stays intact.
If GBP/USD manages to climb above 1.3600 (psychological level, static level) and starts using that level as support, 1.3620 (static level) and 1.3645 (February 10 high) could be targeted.
On the downside, key support seems to have formed at 1.3560 (200-period SMA, Fibonacci 23.6% retracement of the latest uptrend). In case a four-hour candle closes below that level, an extended decline toward 1.3520 (Fibonacci 38.2% retracement, 100-period SMA) and 1.3500 (psychological level) could be witnessed.
Premium
You have reached your limit of 3 free articles for this month.
Start your subscription and get access to all our original articles.
Author

Eren Sengezer
FXStreet
As an economist at heart, Eren Sengezer specializes in the assessment of the short-term and long-term impacts of macroeconomic data, central bank policies and political developments on financial assets.


