GBP/USD Forecast: Sellers wake up as Pound Sterling drops below key support
- GBP/USD has declined below 1.2000 early Thursday following Wednesday's choppy action.
- Rising US Treasury bond yields provide a boost to the USD.
- The technical outlook points to a bearish tilt but the pair could face strong support at 1.1940.

GBP/USD has extended its slide and declined below 1.2000 on Thursday after having failed to capitalize on the broad-based US Dollar (USD) weakness on Wednesday. The pair looks fragile as it closes in on key support area. In the second half of the day, mid-tier data releases from the US will be looked upon for fresh impetus.
Improving risk mood on upbeat macroeconomic data releases from China made it difficult for the US Dollar to find demand on Wednesday. Although GBP/USD climbed toward 1.2100 in the early European session, it came under renewed bearish pressure in the second half of the day.
Stronger-than-expected inflation data from Germany provided a boost to the Euro and the big jump witnessed in the EUR/GBP cross showed that the Euro managed to capture capital outflows out of Pound Sterling.
Early Thursday, the negative shift witnessed in sentiment weighs on the pair. Furthermore, rising US Treasury bond yield help the US Dollar outperform its rivals.
In the second half of the day, the weekly Initial Jobless Claims will be featured in the US economic docket. In case this data climbs above 200K after having stayed below that level for six straight weeks, the US Dollar could lose some interest with the immediate reaction. Nevertheless, market participants are likely to pay closer attention to Wall Street. US stock index futures trade in negative territory and a risk-averse market atmosphere is likely to support the USD during the American trading hours.
GBP/USD Technical Analysis
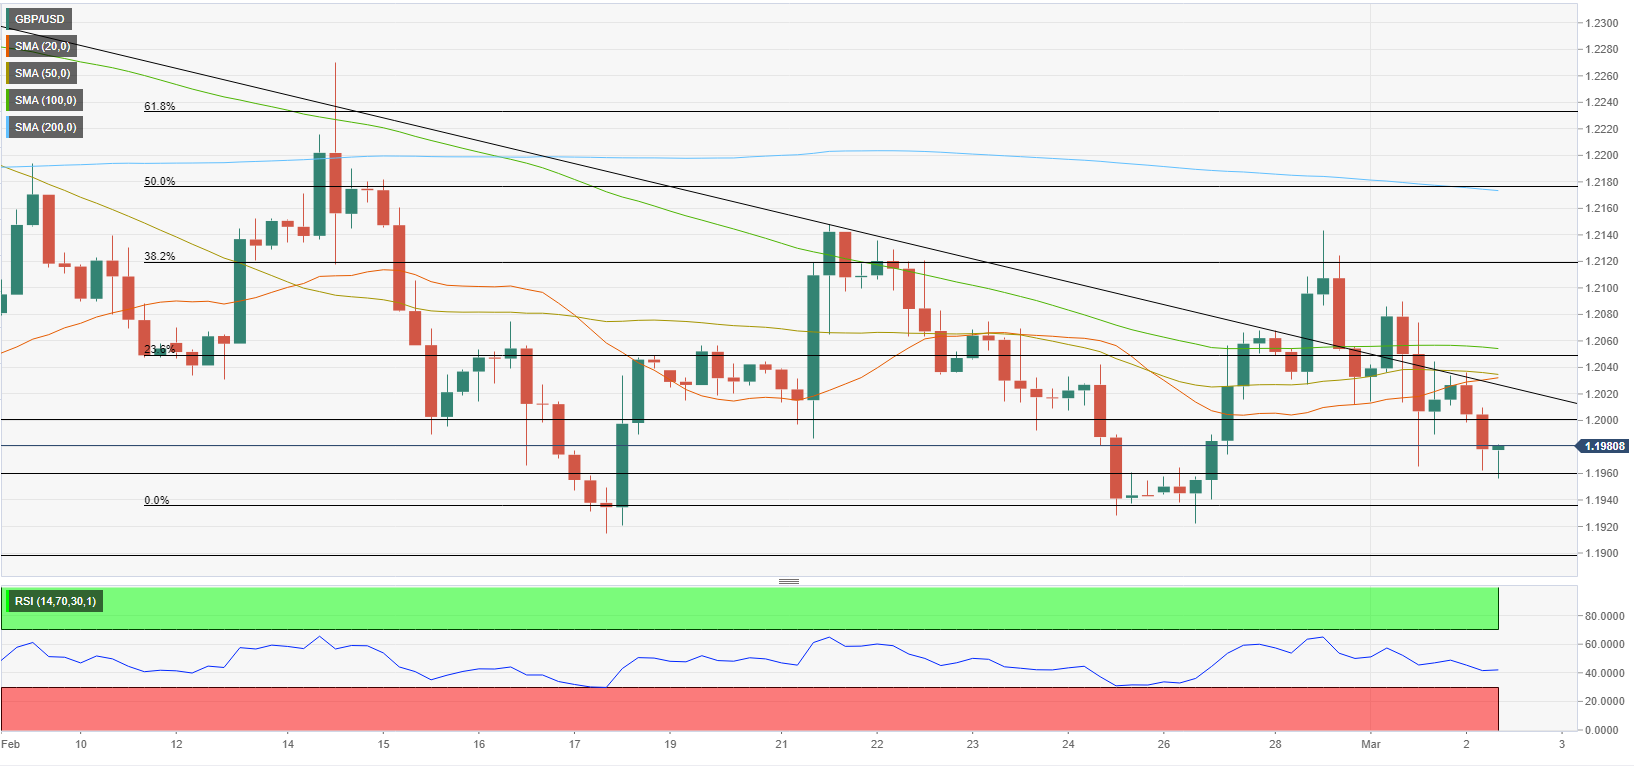
The Relative Strength Index (RSI) indicator on the four-hour chart declined to 40 and GBP/USD returned below the descending trend line after having stayed above it earlier in the week, reflecting the short-term bearish bias.
On the downside, strong support area seems to have formed at 1.1940/1.1950, where the 100-day Simple Moving Average and the end-point of the latest downtrend align. Once this level fails, technical selling pressure could gather strength and trigger an extended slide toward 1.1900 (psychological level, static level) and 1.1840 (January 6 low).
1.2000 (psychological level, static level) aligns as initial resistance before 1.2030 (descending trend line) and 1.2060 (100-period SMA, Fibonacci 23.6% retracement of the latest downtrend).
Premium
You have reached your limit of 3 free articles for this month.
Start your subscription and get access to all our original articles.
Author

Eren Sengezer
FXStreet
As an economist at heart, Eren Sengezer specializes in the assessment of the short-term and long-term impacts of macroeconomic data, central bank policies and political developments on financial assets.


