GBP/USD Forecast: Sellers could take action if 1.2600 support fails
- GBP/USD retreated toward 1.2600 in the early European session on Tuesday.
- Important support area seems to have formed at 1.2550-1.2560.
- The pair could struggle to rebound unless risk mood improves.

GBP/USD continued to edge lower toward 1.2600 early Tuesday after closing the first trading day of the week deep in negative territory. While investors await important macroeconomic data releases from the US, the pair's technical outlook points to a bearish tilt in the short term.
The US Dollar (USD) capitalized on safe haven flows on Monday and caused GBP/USD to stretch lower in the American trading hours. Meanwhile, the steady recovery seen in the US Treasury bond yields following the previous week's sharp slide provided an additional boost to the currency.
Pound Sterling price this week
The table below shows the percentage change of Pound Sterling (GBP) against listed major currencies this week. Pound Sterling was the weakest against the US Dollar.
| USD | EUR | GBP | CAD | AUD | JPY | NZD | CHF | |
| USD | 0.64% | 0.71% | 0.56% | 1.61% | 0.34% | 1.06% | 0.60% | |
| EUR | -0.66% | 0.08% | -0.08% | 0.99% | -0.31% | 0.44% | -0.04% | |
| GBP | -0.74% | -0.08% | -0.16% | 0.90% | -0.37% | 0.36% | -0.14% | |
| CAD | -0.56% | 0.08% | 0.16% | 1.07% | -0.23% | 0.53% | 0.02% | |
| AUD | -1.64% | -1.00% | -0.92% | -1.08% | -1.31% | -0.55% | -1.04% | |
| JPY | -0.38% | 0.31% | 0.53% | 0.23% | 1.29% | 0.74% | 0.25% | |
| NZD | -1.07% | -0.43% | -0.35% | -0.51% | 0.56% | -0.72% | -0.47% | |
| CHF | -0.60% | 0.04% | 0.12% | -0.02% | 1.02% | -0.24% | 0.47% |
The heat map shows percentage changes of major currencies against each other. The base currency is picked from the left column, while the quote currency is picked from the top row. For example, if you pick the Euro from the left column and move along the horizontal line to the Japanese Yen, the percentage change displayed in the box will represent EUR (base)/JPY (quote).
Early Tuesday, the market mood remains cautious amid elevated geopolitical tensions in the Middle East. At the time of writing, the UK's FTSE 100 Index was down 0.2% and US stock index futures were losing between 0.2% and 0.3%.
October JOLTS Job Openings data and the ISM's Services PMI survey for November will be looked upon for fresh impetus in the American session. A noticeable decline to below 9 million in job openings could weigh on the USD and help GBP/USD erase some of its recent losses. On the other hand, a better-than-expected ISM Services PMI print could allow the USD to hold its ground.
GBP/USD Technical Analysis
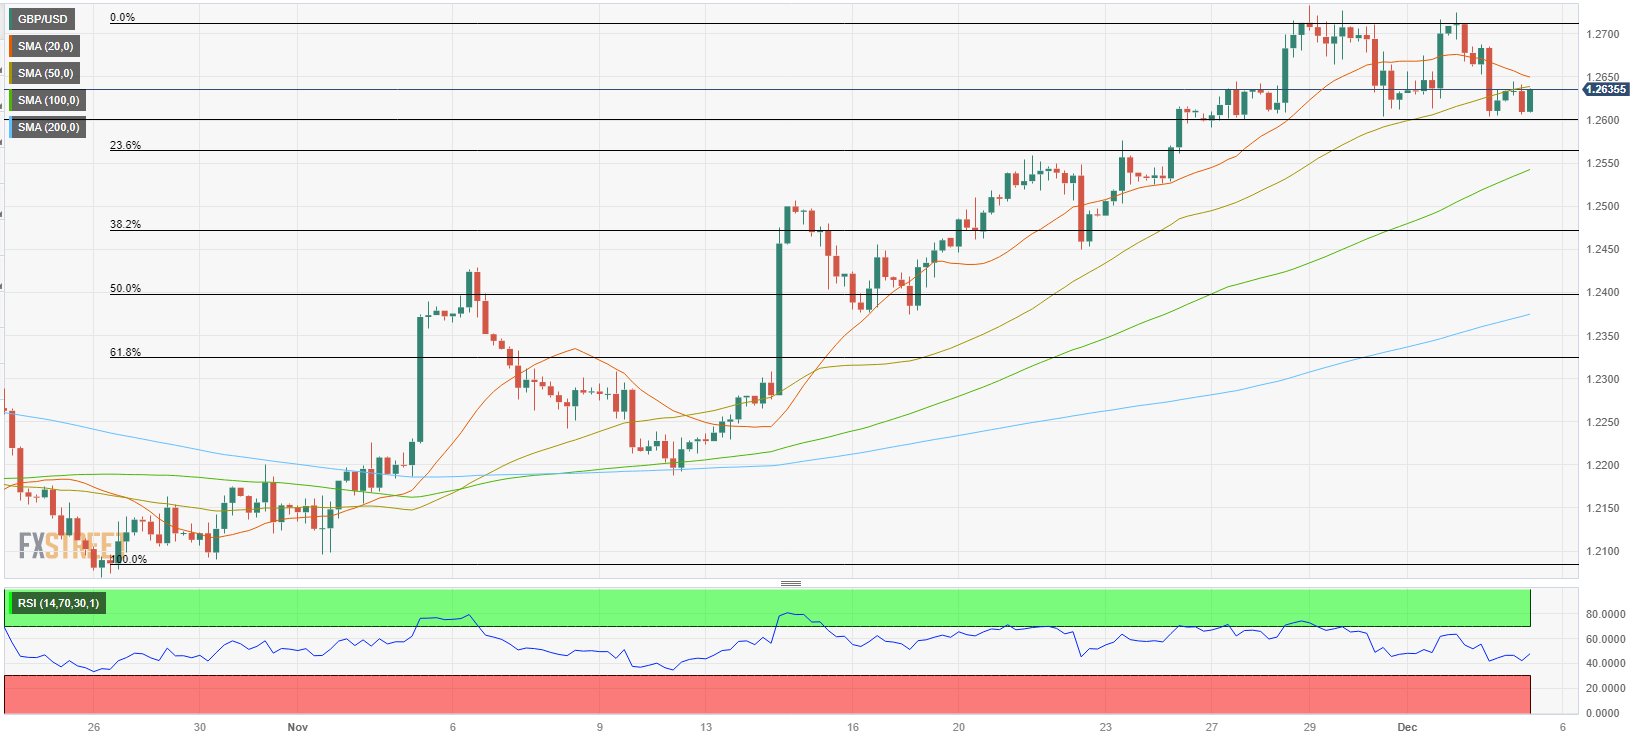
GBP/USD closed the last 4-hour candle below the 20-period and the 50-period Simple Moving Averages (SMA). In the meantime, the Relative Strength Index (RSI) indicator on the same chart retreated slightly below 50, suggesting that buyers are yet to bet on a steady rebound.
On the downside, 1.2600 (psychological level, static level) aligns as first support before 1.2550-1.2560 (Fibonacci 23.6% retracement of the latest uptrend, 100-period SMA) and 1.2500 (psychological level, static level).
In case GBP/USD stabilizes above 1.2650 (20-period SMA, 50-period SMA), it could face next resistances at 1.2700 (psychological level, static level) and 1.2740 (static level).
Premium
You have reached your limit of 3 free articles for this month.
Start your subscription and get access to all our original articles.
Author

Eren Sengezer
FXStreet
As an economist at heart, Eren Sengezer specializes in the assessment of the short-term and long-term impacts of macroeconomic data, central bank policies and political developments on financial assets.