GBP/USD Forecast: Pound to stretch higher as long as 1.2430 support holds
- GBP/USD has advanced to its highest level in 12 days early Tuesday.
- The British pound capitalizes on upbeat UK data and safe-haven flows.
- The dollar stays on the back foot ahead of key data, Powell speech.

GBP/USD has gathered bullish momentum and climbed to its highest level in more than ten days above 1.2450. In case the pair manages to hold above 1.2430, sellers are likely to remain on the sidelines and allow it to continue to push higher.
Earlier in the day, the data from the UK showed that the Unemployment Rate fell to its lowest since 1974 at 3.7% in the first three months of this year. Further details of the publication revealed that the Average Earnings Including Bonus increased by 7% on a yearly basis in March, surpassing the market expectation of 5.4% by a wide margin.
The fact that wage inflation in the UK rose at a faster pace than forecast could be assessed as a development that might force the Bank of England (BOE) to stay on a tightening path.
In the meantime, risk flows continue to dominate the financial markets on Tuesday amid reports revealing no new coronavirus cases had been reported across all districts of Shanghai. The UK's FTSE 100 Index is up 0.8% on the day and US stock index futures are rising between 1% and 1.8%, suggesting that the dollar is likely to stay on the back foot in the second half of the day. As of writing, the US Dollar Index was down 0.5% on the day at 103.68.
The US Census Bureau will release the April Retail Sales data later in the session. FOMC Chairman Jerome Powell is scheduled to speak at an event organized by the Wall Street Journal as well. In case Powell reminds investors of the worsening inflation outlook, the risk rally might lose its steam and limit GBP/USD's upside.
GBP/USD Technical Analysis
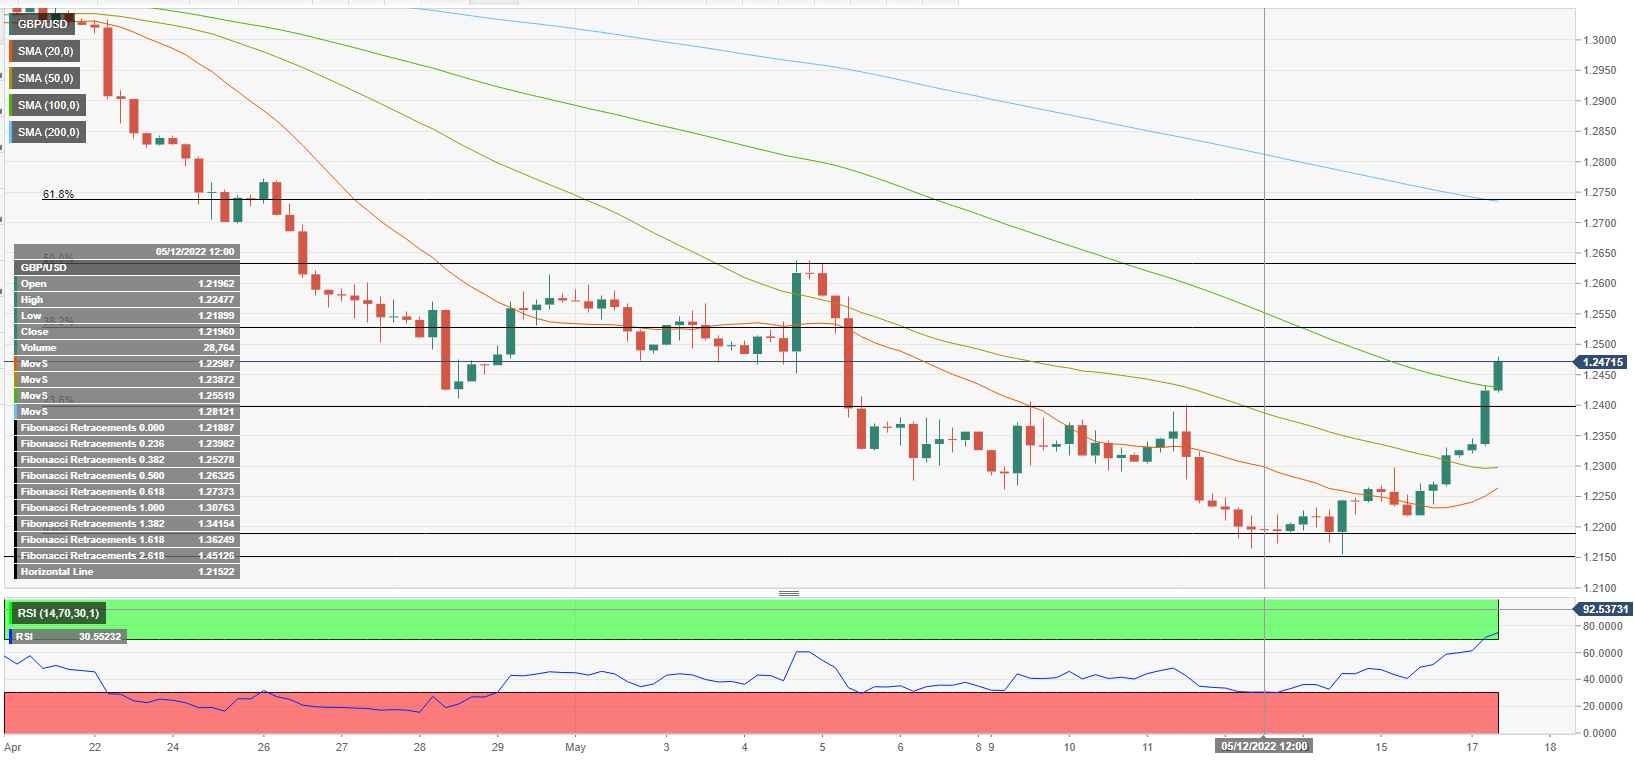
The Relative Strength Index (RSI) indicator on the four-hour chart advanced beyond 70, suggesting that the pair might need to make a downward correction before extending its rally. In such a scenario, sellers are unlikely to show interest as long as the 100-period SMA, currently located at 1.2430, stays intact.
On the upside, 1.2500 (psychological level) aligns as interim resistance ahead of 1.2540 (Fibonacci 38.2% retracement of the downtrend that started on April 21). A daily close above the latter could open the door for additional gains toward 1.2600 (psychological level).
In case 1.2430 support fails, 1.2400 (psychological level, Fibonacci 23.6% retracement) forms the next key support.
Premium
You have reached your limit of 3 free articles for this month.
Start your subscription and get access to all our original articles.
Author

Eren Sengezer
FXStreet
As an economist at heart, Eren Sengezer specializes in the assessment of the short-term and long-term impacts of macroeconomic data, central bank policies and political developments on financial assets.


