GBP/USD Forecast: Pound Sterling turns fragile on soft UK inflation data
- GBP/USD has extended its slide in the early European session on Wednesday.
- Soft inflation figures from the UK weigh on Pound Sterling.
- Additional losses are likely in case GBP/USD breaks below 1.2070.

GBP/USD has extended its slide and declined below 1.2100 early Wednesday following the UK inflation data. The technical outlook points to a bearish tilt in the near term and a four-hour close below 1.2070 could open the door to additional losses.
The UK's Office for National Statistics reported on Wednesday that the Consumer Price Index declined 0.6% on a monthly basis in January, causing the annual rate to retreat to 10.1% from 10.5%. The Core CPI also edged lower to 5.8% from 6.3% on a yearly basis, coming in lower than the market expectation of 6.2%. Although it's too early to say how these figures could influence the Bank of England's (BoE) policy outlook, the reaction suggests that markets have scaled back hawkish BoE bets.
On the other hand, the data from the US revealed that inflation remains sticky in the US. The annual Core CPI inched lower to 5.6% in January from 5.7% in December but came in above the market expectation of 5.5%. On a monthly basis, the Core CPI rose 0.4%, matching December's reading.
The benchmark 10-year US Treasury bond yield advanced to its highest level near 3.8% in over a month after the CPI data, not allowing GBP/USD to shake off the bearish pressure.
In the second half of the day, January Retail Sales data, Federal Reserve Bank of New York's Empire State Manufacturing Survey and the Federal Reserve's Industrial Production figures for January will be featured in the US economic docket.
Markets are currently pricing a more than 80% probability that the Fed will raise its policy rate by at least 25 basis points (bps) in May after a 25 bps hike in March. Since the above-mentioned data releases are unlikely to influence the market positioning in a significant way, risk perception could drive GBP/USD's action in the American session.
US stock index futures were last seen losing between 0.2% and 0.4% on the day. During the Asian trading hours, futures were down more than 0.5%. In case the recovery continues and Wall Street's main indexes managed to open flat or in positive territory, the US Dollar's gains could remain limited in the short term. On the other hand, another bout of flight to safety should weigh on GBP/USD.
GBP/USD Technical Analysis
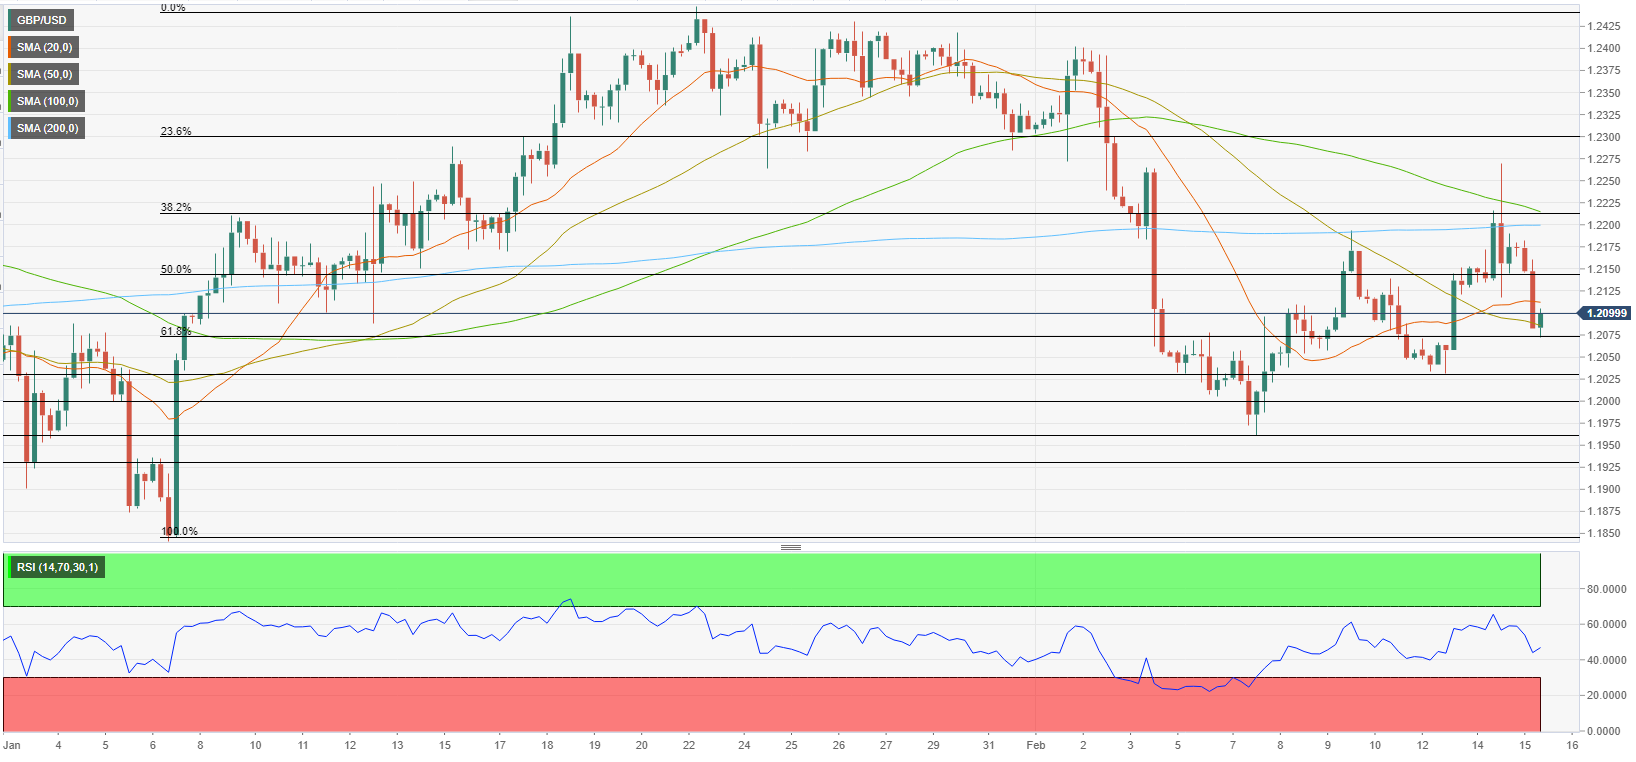
GBP/USD manages to stay above the 50-period SMA on the four-hour chart after having tested that level earlier in the session. The Relative Strength Index (RSI) indicator, however, stays slightly below 50, suggesting that the pair is not out of the woods yet.
1.2075/1.2070 area (50-period SMA, Fibonacci 61.8% retracement of the latest uptrend) aligns as key support level. If GBP/USD falls below that level and starts using it as resistance, it could face interim support at 1.2030 (static level) before targeting 1.2000.
On the upside, 1.2100/1.2110 (psychological level, 20-period SMA) forms immediate resistance ahead of 1.2150 (Fibonacci 50% retracement). A four-hour close above the latter could attract bulls and open the door for an extended recovery toward 1.2200 (200-period SMA).
Premium
You have reached your limit of 3 free articles for this month.
Start your subscription and get access to all our original articles.
Author

Eren Sengezer
FXStreet
As an economist at heart, Eren Sengezer specializes in the assessment of the short-term and long-term impacts of macroeconomic data, central bank policies and political developments on financial assets.


