GBP/USD Forecast: Pound Sterling to face stiff resistance at 1.2550
- GBP/USD has advanced beyond 1.2500 on the back of Wednesday's rally.
- The pair's near-term outlook remains bullish but strong resistance is located at 1.2550.
- US Dollar could find it difficult to stage a steady rebound.

GBP/USD has regained its traction and climbed above 1.2500 early Thursday after having spent the Asian session in a tight range slightly below that level. The pair's bullish bias stays intact but it could find it difficult to clear 1.2550 resistance, at least in the near term.
Although March inflation data from the US had little to no impact on the market expectation for a 25 basis points Federal Reserve (Fed) rate hike in May, the US Dollar (USD) came under heavy selling pressure and fueled GBP/USD's rally.
With the annual Consumer Price Index dropping sharply to 5% in March from 6% in February, investors seem to be leaning toward a looser Fed policy in the second half of the year regardless of the next rate decision. According to the CME Group FedWatch Tool, there is nearly a 70% probability that the Fed's policy rate will be below 4.5%-4.75% range by the end of the year. Currently, the Fed's policy rate is 4.75%-5%.
Later in the day, the US Bureau of Labor Statistics will release the Producer Price Index (PPI) data, which is forecast to decline to 3% from 4.6% in February. A soft PPI reading could be an excuse for investors to stay away from the USD in the second half of the day. On the other hand, the USD is likely to hold its ground if the data arrives close to February's print.
Market participants will continue to pay close attention to risk perception in the American session. Wall Street's main indexes failed to capitalize on the inflation data but US stock index futures trade modestly higher early Thursday. In case US stocks gain traction, the USD could struggle to stay resilient against its major rivals.
GBP/USD Technical Analysis
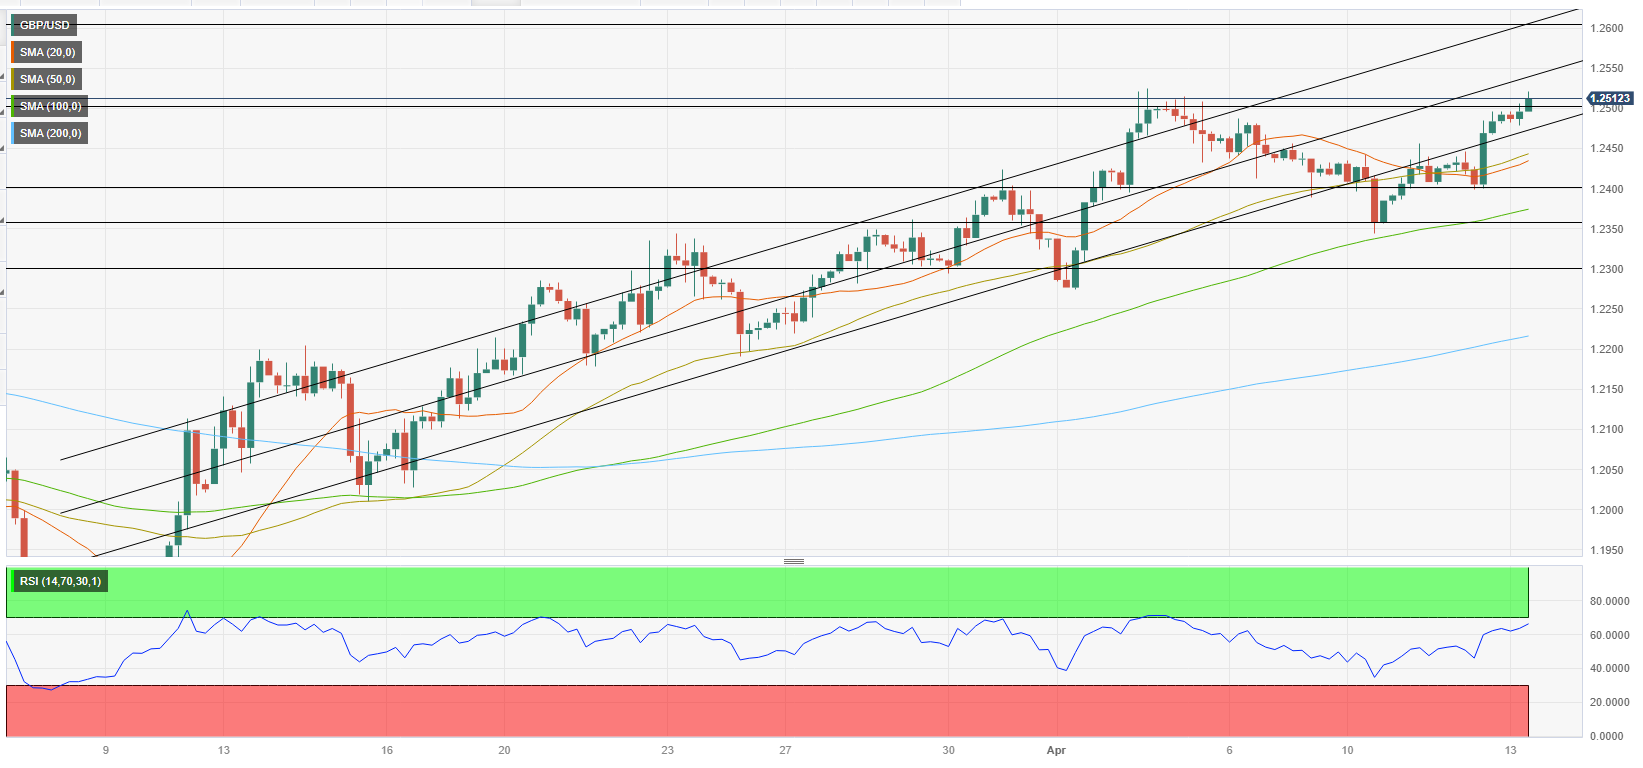
The mid-point of the ascending regression channel aligns as strong resistance at 1.2550. In case GBP/USD rises to that level without pulling back first, the Relative Strength Index (RSI) indicator on the four-hour chart could climb into the overbought territory above 70 and trigger a correction.
On the downside, 1.2500/1.2490 (psychological level, lower limit of the ascending channel) forms initial support. A four-hour close below that level could open the door for an extended decline toward 1.2450 (50-period Simple Moving Average (SMA) and 1.2400 (psychological level, static level).
In case the pair clears 1.2550 and confirms that level as support, it could target 1.2600 (psychological level, static level) and 1.2620 (upper limit of the ascending channel).
Premium
You have reached your limit of 3 free articles for this month.
Start your subscription and get access to all our original articles.
Author

Eren Sengezer
FXStreet
As an economist at heart, Eren Sengezer specializes in the assessment of the short-term and long-term impacts of macroeconomic data, central bank policies and political developments on financial assets.


