• GBP/USD has been fluctuating in a narrow channel at the beginning of the week.
  • GDP in the UK grew unexpectedly in October.
  • The pair could have a hard time finding direction in the short term.

GBP/USD has started the new week in an indecisive manner with market participants refraining from making large bets ahead of the high-tier data releases and all-important central bank decisions.  The pair's short-term technical outlook points to a loss of bullish momentum but it would be surprising to see a significant move in either direction in the remainder of the day.

Earlier in the day, the data published by the UK's Office for National Statistics (ONS) revealed that Gross Domestic Product (GDP) grew by 0.5% on a monthly basis in October following September's 0.6% contraction. This reading came in much better than the market expectation for a contraction of 0.1% but the positive impact of the upbeat GDP data on the Pound Sterling remained short-lived. 

Following the GDP data, UK Finance Minster Jeremy Hunt told BBC News that the UK economy was likely to get worse before it gets better.

Meanwhile, the UK's FTSE 100 Index trades modestly lower on the day and the US stock index futures hold flat, pointing to a neutral market mood on Monday.

The US economic docket will not offer any high-impact data releases. The 10-year US Treasury note auction could impact the US Dollar's valuation in the American session but the pair is likely to extend its consolidation at least until tomorrow's UK jobs data and US inflation report.

GBP/USD Technical Analysis

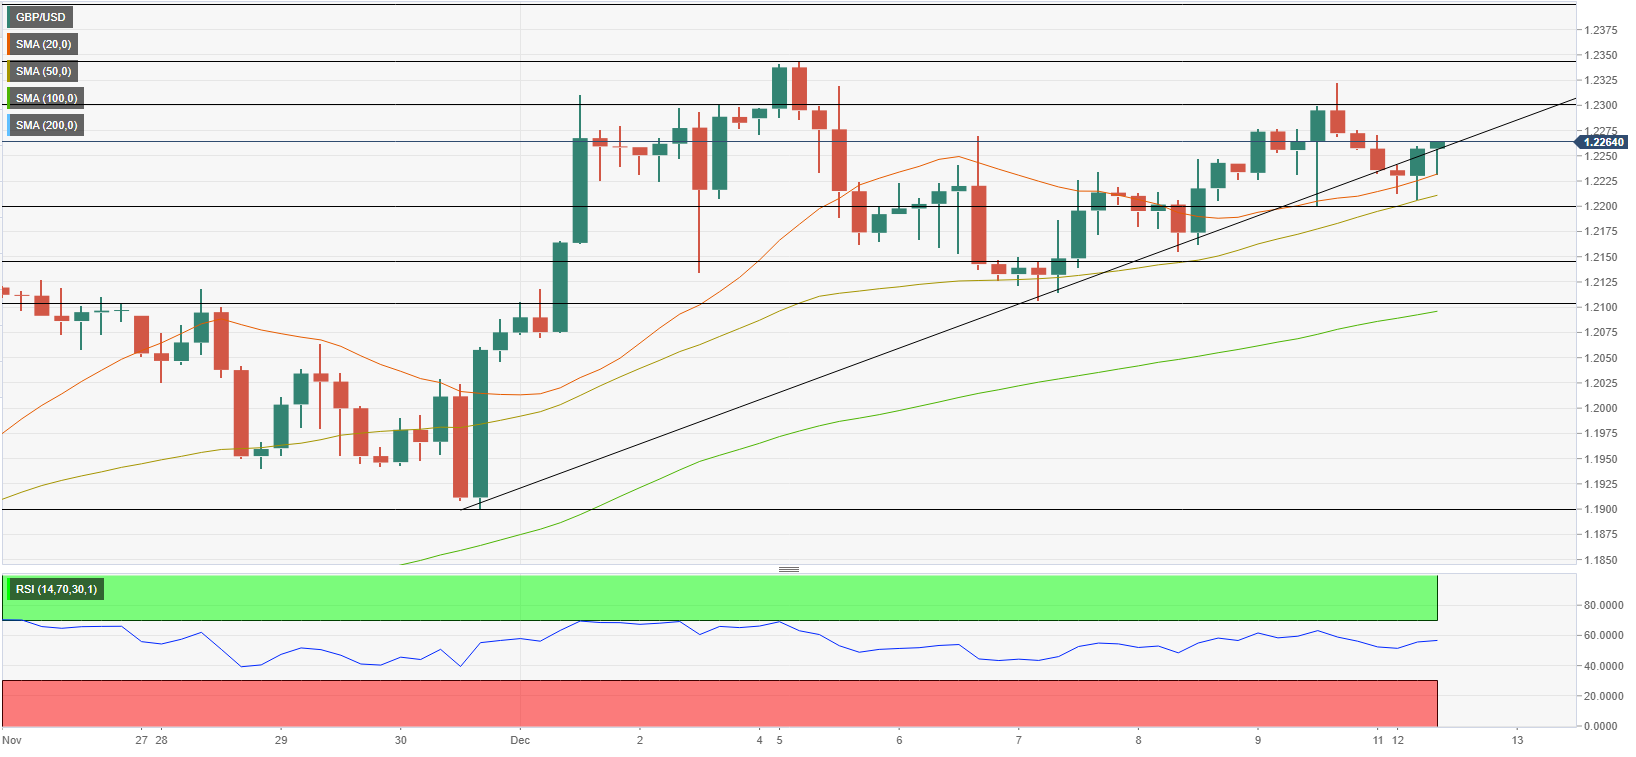
GBP/USD managed to stage a rebound following the earlier decline and returned above the ascending trend line coming from early December. It's worth noting, however, the Relative Strength (RSI) indicator on the four-hour chart stays flat slightly above 50, suggesting that the pair is struggling to gather bullish momentum.

On the upside, 1.2300 (static level, psychological level) aligns as initial resistance before 1.2350 (static level) and 1.2400 (psychological level).

Supports are located at 1.2230 (20-period Simple Moving Average (SMA) on the four-hour chart), 1.2200 (psychological level, 50-period SMA) and 1.2150 (static level).

Information on these pages contains forward-looking statements that involve risks and uncertainties. Markets and instruments profiled on this page are for informational purposes only and should not in any way come across as a recommendation to buy or sell in these assets. You should do your own thorough research before making any investment decisions. FXStreet does not in any way guarantee that this information is free from mistakes, errors, or material misstatements. It also does not guarantee that this information is of a timely nature. Investing in Open Markets involves a great deal of risk, including the loss of all or a portion of your investment, as well as emotional distress. All risks, losses and costs associated with investing, including total loss of principal, are your responsibility. The views and opinions expressed in this article are those of the authors and do not necessarily reflect the official policy or position of FXStreet nor its advertisers. The author will not be held responsible for information that is found at the end of links posted on this page.

If not otherwise explicitly mentioned in the body of the article, at the time of writing, the author has no position in any stock mentioned in this article and no business relationship with any company mentioned. The author has not received compensation for writing this article, other than from FXStreet.

FXStreet and the author do not provide personalized recommendations. The author makes no representations as to the accuracy, completeness, or suitability of this information. FXStreet and the author will not be liable for any errors, omissions or any losses, injuries or damages arising from this information and its display or use. Errors and omissions excepted.

The author and FXStreet are not registered investment advisors and nothing in this article is intended to be investment advice.

Recommended Content


Recommended Content

Editors’ Picks

AUD/USD: Uptrend remains capped by 0.6650

AUD/USD: Uptrend remains capped by 0.6650

AUD/USD could not sustain the multi-session march north and faltered once again ahead of the 0.6650 region on the back of the strong rebound in the Greenback and the prevailing risk-off mood.

AUD/USD News

EUR/USD meets a tough barrier around 1.0800

EUR/USD meets a tough barrier around 1.0800

The resurgence of the bid bias in the Greenback weighed on the risk-linked assets and motivated EUR/USD to retreat to the 1.0750 region after another failed attempt to retest the 1.0800 zone.

EUR/USD News

Gold eases toward $2,310 amid a better market mood

Gold eases toward $2,310 amid a better market mood

After falling to $2,310 in the early European session, Gold recovered to the $2,310 area in the second half of the day. The benchmark 10-year US Treasury bond yield stays in negative territory below 4.5% and helps XAU/USD find support.

Gold News

Bitcoin price coils up for 20% climb, Standard Chartered forecasts more gains for BTC

Bitcoin price coils up for 20% climb, Standard Chartered forecasts more gains for BTC

Bitcoin (BTC) price remains devoid of directional bias, trading sideways as part of a horizontal chop. However, this may be short-lived as BTC price action consolidates in a bullish reversal pattern on the one-day time frame.

Read more

What does stagflation mean for commodity prices?

What does stagflation mean for commodity prices?

What a difference a quarter makes. The Federal Reserve rang in 2024 with a bout of optimism that inflation was coming down to their 2% target. But that optimism has now evaporated as the reality of stickier-than-expected inflation becomes more evident. 

Read more

Majors

Cryptocurrencies

Signatures