GBP/USD Forecast: Pound Sterling needs dovish Fed surprise to extend rebound
- GBP/USD continues to edge higher and trades above 1.2900 following Tuesday's rebound.
- The near-term technical outlook points to a bullish tilt.
- Investors could ignore technical readings while assessing the Fed's policy announcements.

GBP/USD edged higher early Wednesday after snapping a seven-day losing streak on Tuesday. The pair clings to small daily gains above 1.2900 in the European session but the trading action remains subdued ahead of the US Federal Reserve's (Fed) policy announcements.
On Tuesday, Pound Sterling benefited from risk flows as Wall Street's main indexes turned north following a mixed opening. In the European session, the UK's FTSE 100 Index is down 0.3% and US stock index futures trade modestly lower, reflecting a cautious market stance that could limit GBP/USD's upside.
The Fed is forecast to lift its policy rate by 25 basis points (bps) to the range of 5.25%-5.5% later in the day. Since such a decision is already priced in, the policy statement language and FOMC Chairman Jerome Powell's comments on the policy outlook could drive the US Dollar's valuation.
Although the June dot plot showed that most policymakers saw it appropriate to raise the policy rate at least twice more in 2023, soft inflation readings for June revived optimism about the Fed reaching the terminal rate with a hike in July.
With recent macroeconomic data releases from the US reaffirming tight labor market conditions and the relatively healthy economic activity, investors scaled back dovish Fed bets.
According to the CME Group FedWatch Tool, markets price in a 33% probability of one more rate increase in November, up from nearly 20% that was seen following the June Consumer Price Index (CPI) figures.
If the Fed changes its tone and says that they will monitor the data before deciding whether another rate increase will be needed, the USD could come under renewed selling pressure. On the other hand, a confirmation of one more rate increase either in November or December could help the USD continue to gather strength, forcing GBP/USD to turn south.
GBP/USD Technical Analysis
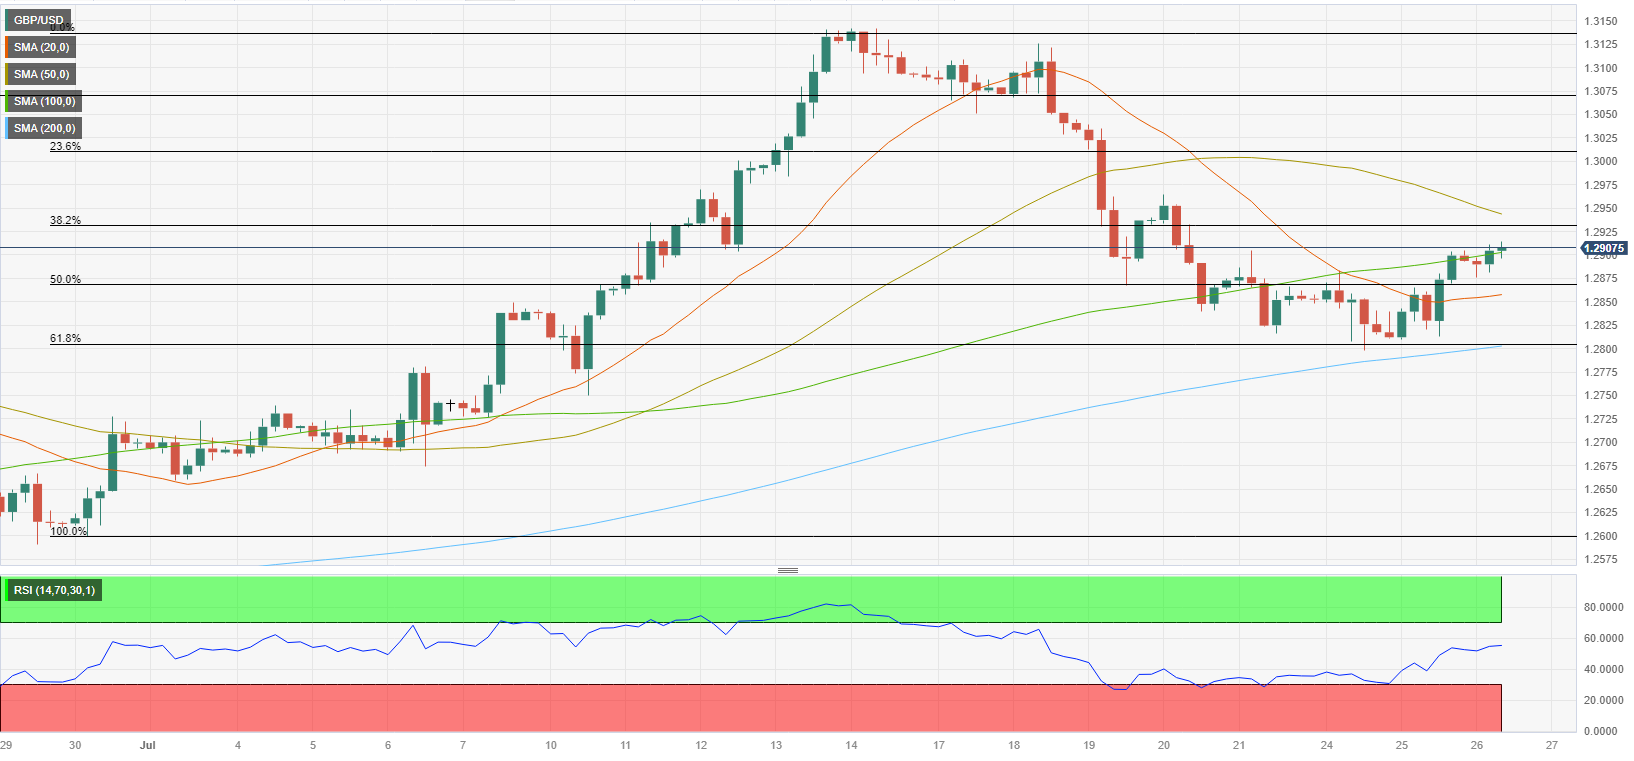
The Relative Strength Index (RSI) indicator on the 4-hour chart climbed above 50 and the last 4-hour GBP/USD candle closed above the 100-period Simple Moving Average (SMA), reflecting a buildup of bullish momentum.
The 1.2930 level (Fibonacci 38.2% retracement of the latest uptrend, 50-period SMA) aligns as immediate resistance ahead of 1.3000 (psychological level, Fibonacci 23.6% retracement) and 1.3070 (static level).
Looking south, 1.2900 (100-period SMA, psychological level) acts as interim support before 1.2870 (Fibonacci 50% retracement). A 4-hour close below the latter could attract sellers and trigger another leg lower toward 1.2800 (200-period SMA, Fibonacci 61.8% retracement).
Premium
You have reached your limit of 3 free articles for this month.
Start your subscription and get access to all our original articles.
Author

Eren Sengezer
FXStreet
As an economist at heart, Eren Sengezer specializes in the assessment of the short-term and long-term impacts of macroeconomic data, central bank policies and political developments on financial assets.


