GBP/USD Forecast: Pound Sterling looks fragile despite quiet start to week
- GBP/USD moves up and down in a tight channel above 1.2900 early Monday.
- Improving risk mood could help the pair limit its losses.
- The US economic calendar will not offer any data releases that could impact the pair's action.

After reaching its highest level in a year above 1.3000 last week, GBP/USD closed the week in negative territory after declining sharply on Thursday and Friday. The pair stays relatively quiet early Monday but the technical outlook is yet to point to a buildup of recovery momentum.
British Pound PRICE Last 7 days
The table below shows the percentage change of British Pound (GBP) against listed major currencies last 7 days. British Pound was the weakest against the Japanese Yen.
| USD | EUR | GBP | JPY | CAD | AUD | NZD | CHF | |
|---|---|---|---|---|---|---|---|---|
| USD | 0.14% | 0.47% | -0.91% | 0.73% | 1.81% | 1.81% | -0.76% | |
| EUR | -0.14% | 0.36% | -0.85% | 0.78% | 1.71% | 1.87% | -0.71% | |
| GBP | -0.47% | -0.36% | -1.13% | 0.42% | 1.34% | 1.45% | -1.07% | |
| JPY | 0.91% | 0.85% | 1.13% | 1.65% | 2.52% | 2.71% | -0.04% | |
| CAD | -0.73% | -0.78% | -0.42% | -1.65% | 1.00% | 1.08% | -1.49% | |
| AUD | -1.81% | -1.71% | -1.34% | -2.52% | -1.00% | 0.16% | -2.37% | |
| NZD | -1.81% | -1.87% | -1.45% | -2.71% | -1.08% | -0.16% | -2.54% | |
| CHF | 0.76% | 0.71% | 1.07% | 0.04% | 1.49% | 2.37% | 2.54% |
The heat map shows percentage changes of major currencies against each other. The base currency is picked from the left column, while the quote currency is picked from the top row. For example, if you pick the British Pound from the left column and move along the horizontal line to the US Dollar, the percentage change displayed in the box will represent GBP (base)/USD (quote).
The risk-averse market atmosphere ahead of the weekend helped the US Dollar (USD) gather strength against its rivals and forced GBP/USD to edge lower. Early Monday, the UK's FTSE 100 Index is up more than 0.5% and US stock index futures trade in positive territory, reflecting an improvement in market mood. In case risk flows dominate the action in financial markets in the second half of the day, the USD could struggle to find demand and allow the pair to edge higher.
Over the weekend, US President Joe Biden announced that he has withdrawn from the Presidential race and endorsed Vice President Kamala Harris as the new nominee. Harris' nomination is yet to be made official by the Democratic Party. It's too early to know how this political development could impact the outcome of the election and the US economic outlook. Hence, the market reaction remains largely muted.
On Wednesday, preliminary Services and Manufacturing PMI from both the UK and the US will be looked upon for fresh impetus. In the second half of the week, the first estimate of the second-quarter Gross Domestic Product data from the US and the Personal Consumption Expenditures (PCE) Price Index, the Federal Reserve's preferred gauge of inflation, figures could drive the USD's valuation.
GBP/USD Technical Analysis
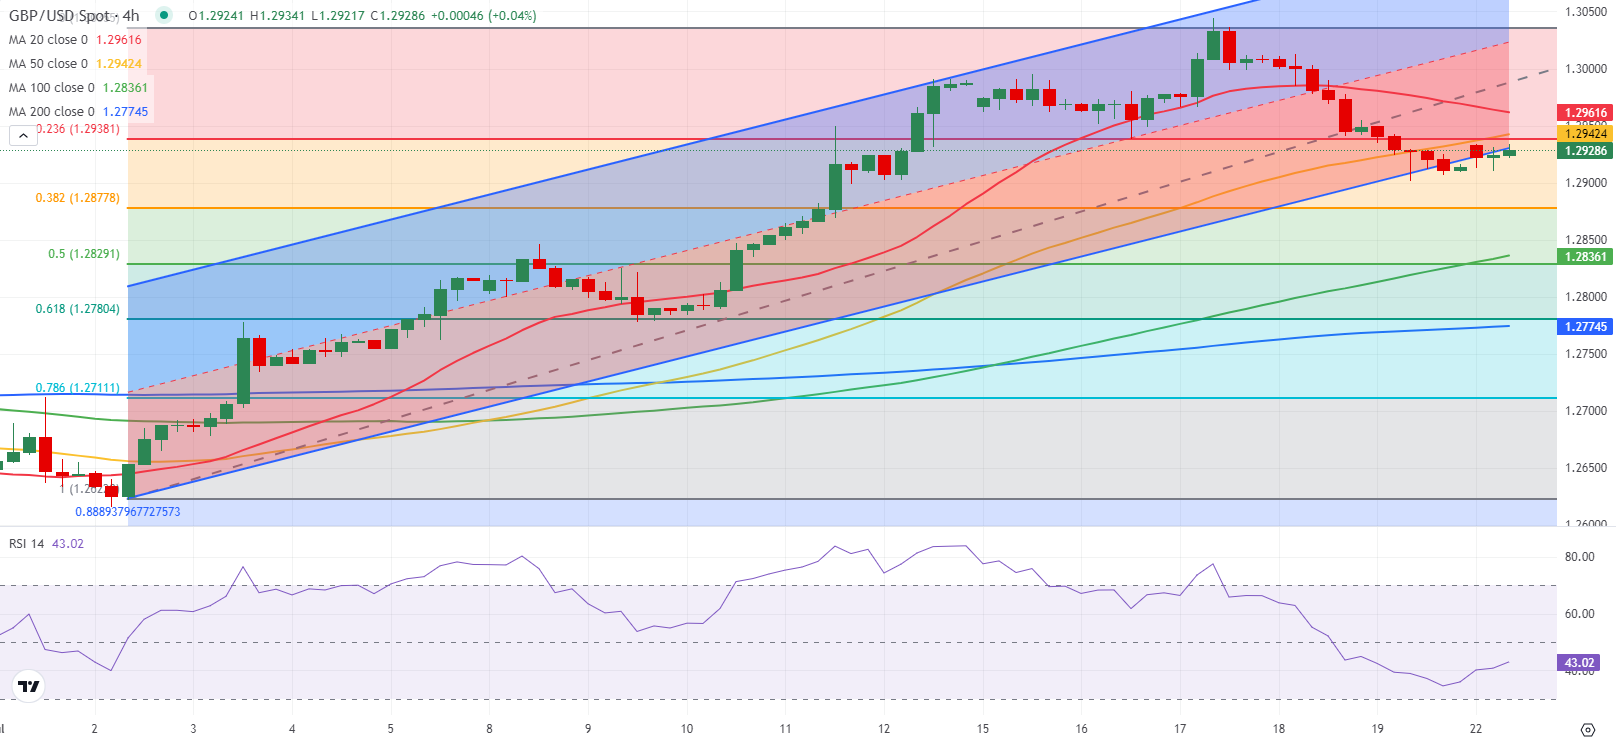
GBP/USD trades slightly below the lower limit of the ascending regression channel coming from early July and the Relative Strength Index (RSI) indicator on the 4-hour chart stays below 50, suggesting that the pair is having a hard time gathering recovery momentum.
On the upside, 1.2930-1.2940 (50-period Simple Moving Average (SMA), lower limit of the channel) aligns as immediate resistance before 1.3000 (psychological level, static level) and 1.3030 (mid-point of the channel).
Supports could be seen at 1.2900 (psychological level, static level), 1.2875 (Fibonacci 38.2% retracement) and 1.2830 (Fibonacci 50% retracement, 100-period SMA).
Pound Sterling FAQs
The Pound Sterling (GBP) is the oldest currency in the world (886 AD) and the official currency of the United Kingdom. It is the fourth most traded unit for foreign exchange (FX) in the world, accounting for 12% of all transactions, averaging $630 billion a day, according to 2022 data. Its key trading pairs are GBP/USD, aka ‘Cable’, which accounts for 11% of FX, GBP/JPY, or the ‘Dragon’ as it is known by traders (3%), and EUR/GBP (2%). The Pound Sterling is issued by the Bank of England (BoE).
The single most important factor influencing the value of the Pound Sterling is monetary policy decided by the Bank of England. The BoE bases its decisions on whether it has achieved its primary goal of “price stability” – a steady inflation rate of around 2%. Its primary tool for achieving this is the adjustment of interest rates. When inflation is too high, the BoE will try to rein it in by raising interest rates, making it more expensive for people and businesses to access credit. This is generally positive for GBP, as higher interest rates make the UK a more attractive place for global investors to park their money. When inflation falls too low it is a sign economic growth is slowing. In this scenario, the BoE will consider lowering interest rates to cheapen credit so businesses will borrow more to invest in growth-generating projects.
Data releases gauge the health of the economy and can impact the value of the Pound Sterling. Indicators such as GDP, Manufacturing and Services PMIs, and employment can all influence the direction of the GBP. A strong economy is good for Sterling. Not only does it attract more foreign investment but it may encourage the BoE to put up interest rates, which will directly strengthen GBP. Otherwise, if economic data is weak, the Pound Sterling is likely to fall.
Another significant data release for the Pound Sterling is the Trade Balance. This indicator measures the difference between what a country earns from its exports and what it spends on imports over a given period. If a country produces highly sought-after exports, its currency will benefit purely from the extra demand created from foreign buyers seeking to purchase these goods. Therefore, a positive net Trade Balance strengthens a currency and vice versa for a negative balance.
Author

Eren Sengezer
FXStreet
As an economist at heart, Eren Sengezer specializes in the assessment of the short-term and long-term impacts of macroeconomic data, central bank policies and political developments on financial assets.


