GBP/USD Forecast: Pound Sterling fails to clear important hurdle
- GBP/USD has settled above 1.2400 following Wednesday's volatile action.
- The pair needs to flip 1.2480 into support to attract buyers.
- Wall Street's main indexes point to a negative opening on Thursday.

Despite the renewed US Dollar (USD) strength on Wednesday, GBP/USD managed to close in positive territory on Wednesday as hawkish Bank of England (BoE) bets after hot UK inflation data helped Pound Sterling stay resilient against its rivals. The pair, however, has lost its traction after having met resistance near 1.2480 and gone into a consolidation phase.
Early Thursday, US stock index futures trade deep in negative territory amid heavy losses witnessed in big tech stocks following disappointing earnings figures. As investors struggle to find the next fundamental driver, the market mood could drive the pair's action in the second half of the day. A negative opening in Wall Street accompanied by a flight to safety could support the USD and weigh on GBP/USD and vice versa.
The US economic docket will feature the weekly Initial Jobless Claims data, which is expected to come in at 240K in the week ending April 15, and Existing Home Sales for March. More importantly, several Fed policymakers will be delivering speeches.
At this point, however, markets are fairly certain that the Federal Reserve will raise its policy rate by 25 basis points (bps) at the upcoming policy meeting. It would be very surprising to see that view change based on the data releases and Fedspeak.
On Friday, March Retail Sales data will be featured in the UK economic docket and S&P Global will release the preliminary Manufacturing and Services PMI surveys both for the UK and the US.
GBP/USD Technical Analysis
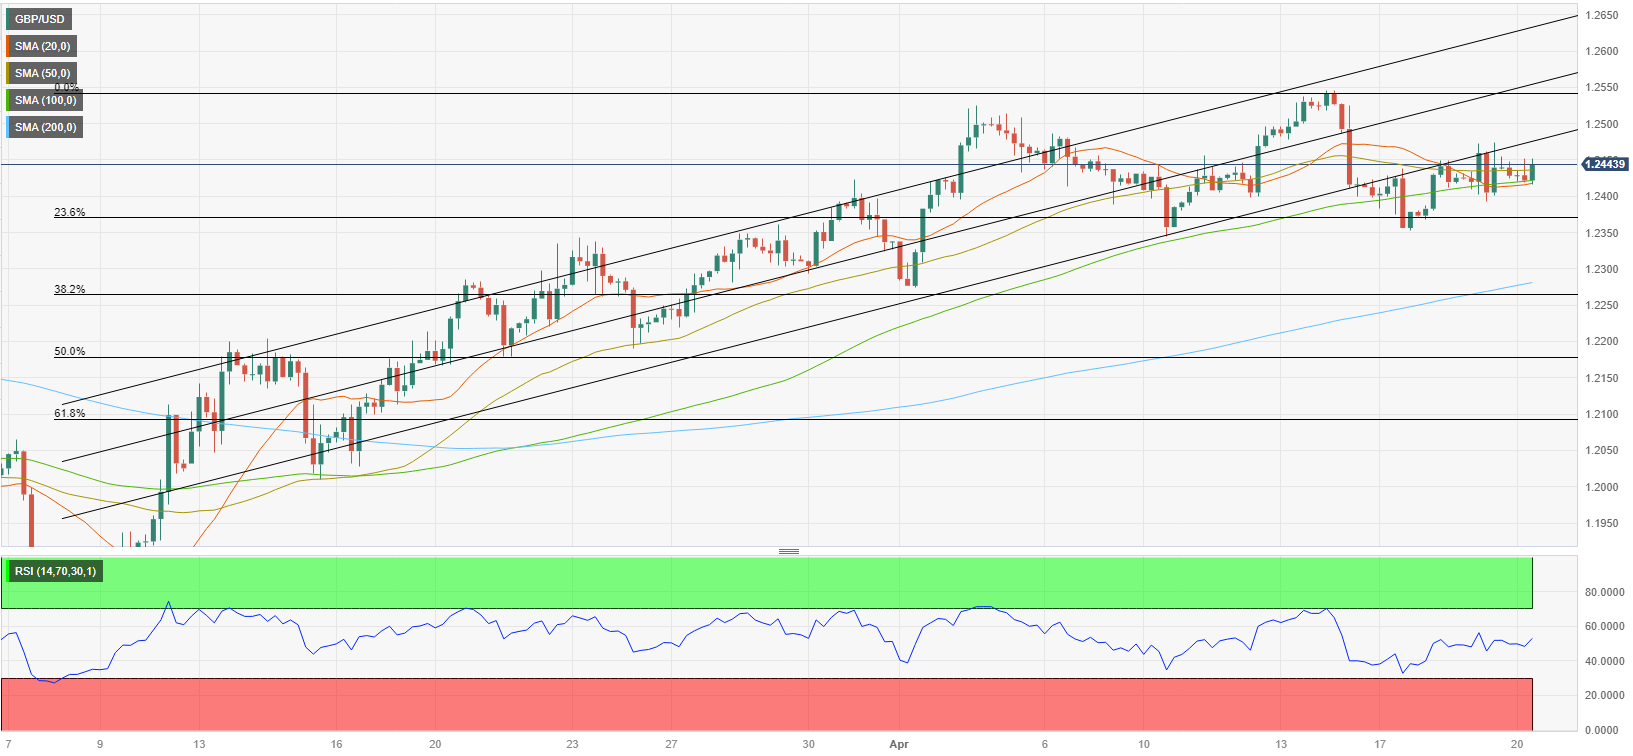
GBP/USD continues to trade above 1.2430, where the 20-period and the 100-period Simple Moving Averages (SMA) are located on the four-hour chart. In case the pair makes a four-hour close below that level, it could fall toward 1.2400 (psychological level, static level) and 1.2370 (Fibonacci 23.6% retracement of the latest uptrend).
On the upside, 1.2480 (lower limit of the broken regression channel) acts as first resistance before 1.2500 (psychological level, static level) and 1.2550 (mid-point of the ascending channel, static level).
Premium
You have reached your limit of 3 free articles for this month.
Start your subscription and get access to all our original articles.
Author

Eren Sengezer
FXStreet
As an economist at heart, Eren Sengezer specializes in the assessment of the short-term and long-term impacts of macroeconomic data, central bank policies and political developments on financial assets.


