GBP/USD Forecast: Pound Sterling eyes a test of 1.2200
- GBP/USD dropped to its lowest level since March on Monday.
- The cautious market mood weighs on the pair to begin the week.
- A violation of 1.2200 could trigger another leg lower.

GBP/USD came under bearish pressure in the early European session and dropped to its lowest level since March below 1.2230. The negative shift seen in risk sentiment seems to be helping the US Dollar gather strength and weighs on the pair.
News of China's Evergrande halting new debt issuance due to an ongoing investigation into its main domestic subsidiary, Hengda Real Estate Group Co Ltd, caused investors to move away from risk-sensitive assets in the Asian session. Following the sharp decline seen in major Asian equity indices, the UK's FTSE opened deep in negative territory, reflecting the souring market mood.
Pound Sterling price today
The table below shows the percentage change of Pound Sterling (GBP) against listed major currencies today. Pound Sterling was the weakest against the US Dollar.
| USD | EUR | GBP | CAD | AUD | JPY | NZD | CHF | |
| USD | 0.17% | 0.15% | 0.00% | 0.36% | 0.06% | 0.09% | 0.29% | |
| EUR | -0.17% | -0.03% | -0.16% | 0.16% | -0.12% | -0.08% | 0.10% | |
| GBP | -0.16% | 0.02% | -0.13% | 0.18% | -0.09% | -0.05% | 0.14% | |
| CAD | -0.01% | 0.16% | 0.15% | 0.32% | 0.05% | 0.08% | 0.27% | |
| AUD | -0.31% | -0.16% | -0.18% | -0.32% | -0.27% | -0.19% | -0.04% | |
| JPY | -0.08% | 0.11% | 0.08% | -0.08% | 0.25% | 0.04% | 0.21% | |
| NZD | -0.11% | 0.08% | 0.07% | -0.09% | 0.18% | -0.04% | 0.19% | |
| CHF | -0.28% | -0.10% | -0.11% | -0.25% | 0.06% | -0.21% | -0.18% |
The heat map shows percentage changes of major currencies against each other. The base currency is picked from the left column, while the quote currency is picked from the top row. For example, if you pick the Euro from the left column and move along the horizontal line to the Japanese Yen, the percentage change displayed in the box will represent EUR (base)/JPY (quote).
In the absence of high-impact data releases, the USD's valuation could continue to be driven by risk perception. At the time of press, the US Dollar Index was up 0.17% on the day at 105.75. Meanwhile, US stock index futures were down between 0.2% and 0.3%, pointing to a bearish opening in Wall Street.
Later in the week, second-quarter Gross Domestic Product (GDP) growth data from the UK and the Personal Consumption Expenditures (PCE) Price Index data – the Federal Reserve's preferred gauge of inflation – from the US will be watched closely by market participants.
GBP/USD Technical Analysis
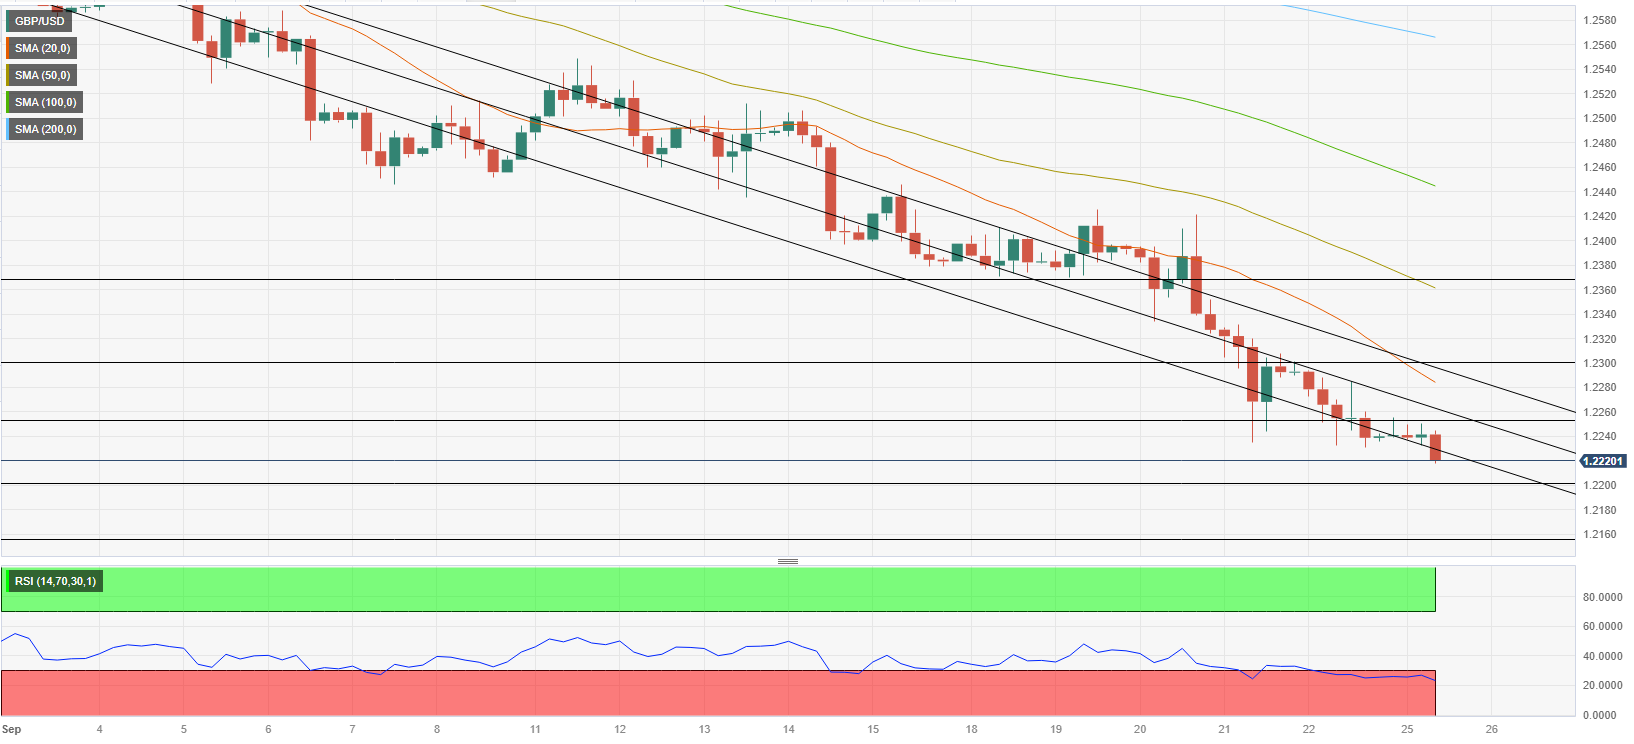
The Relative Strength Index (RSI) indicator on the 4-hour chart stays below 30 and GBP/USD trades below the lower limit of the descending regression channel, pointing to an overdue technical correction. The mid-point of the descending channel aligns as first resistance at 1.2250 ahead of 1.2280 (upper limit of the descending channel) and 1.2300 (psychological level, static level).
On the downside, immediate support is seen at 1.2200 (static level, psychological level). A 4-hour close below that level could open the door for an extended slide toward 1.2140 (static level from January). If the pair falls to 1.2200 but manages to hold above that level, there could be a technical correction before that level is tested again.
Premium
You have reached your limit of 3 free articles for this month.
Start your subscription and get access to all our original articles.
Author

Eren Sengezer
FXStreet
As an economist at heart, Eren Sengezer specializes in the assessment of the short-term and long-term impacts of macroeconomic data, central bank policies and political developments on financial assets.


