GBP/USD Forecast: Pound Sterling could stage a correction in case 1.1900 holds
- GBP/USD has suffered large losses amid renewed US Dollar strength.
- The positive shift witnessed in risk sentiment doesn't help the pair find support.
- 1.1900 aligns as next key support for the pair.
GBP/USD has turned south and declined to fresh monthly lows near 1.1900 with the US Dollar regathering its strength early Tuesday. The risk-positive market environment doesn't seem to be helping the Pound Sterling find support for the time being but the technical outlook suggests that the pair is about to turn oversold.
With trading conditions normalizing following the New Year holiday, the US Dollar started to outperform its rivals in the early European session.
It's worth noting, however, that stock markets point to a risk-positive market environment, which usually makes it difficult for the US Dollar to find demand. At the time of press, the UK's FTSE 100 Index was up nearly 2% on the day and the US stock index futures were gaining between 0.8% and 1%. Furthermore, the benchmark 10-year US Treasury bond yield is down nearly 2% at around 3.75%.
Both of these market developments contradict the broad-based US Dollar strength. The US Dollar Index (DXY) is already up more than 1% on the day but a strong rally in Wall Street after the opening bell could limit the DXY's upside, in case orthodox inter-market correlations return.
S&P Global's Manufacturing PMI for December (final) will be featured in the US economic docket but it would be surprising to see a significant market reaction to this data.
GBP/USD Technical Analysis
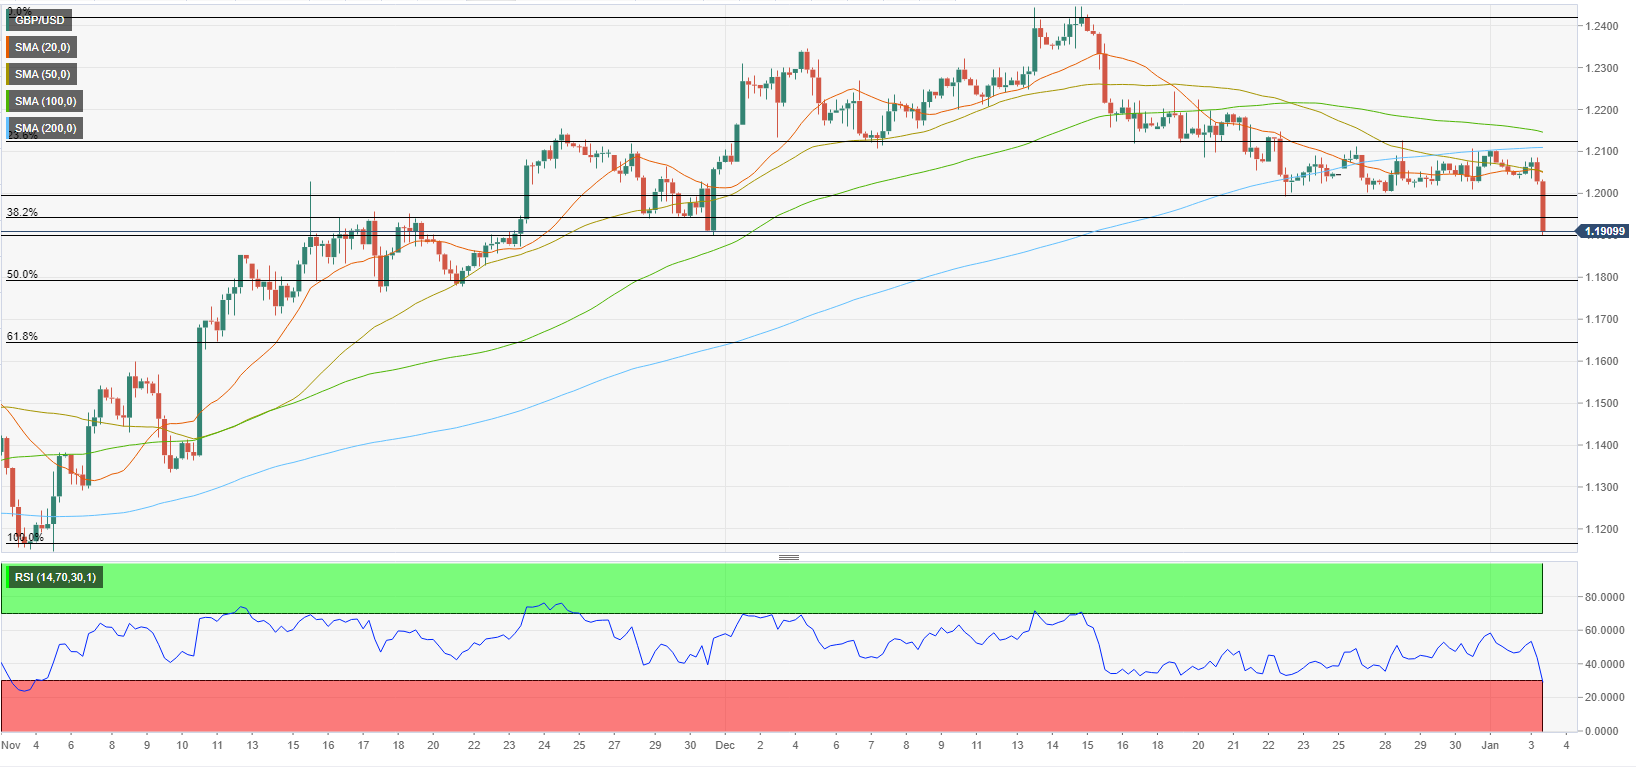
GBP/USD trades within a touching distance of 1.1900 (psychological level, static level). If buyers fail to defend that level, the pair could continue to fall toward 1.1800 (Fibonacci 50% retracement of the latest uptrend). Meanwhile, the Relative Strength Index (RSI) indicator on the four-hour chart fell to 30, suggesting that the pair could stage a technical correction before the next leg lower.
On the upside, 1.1940 (Fibonacci 38.2% retracement) aligns as initial resistance before 1.2000 (psychological level, static level, former support) and 1.2050 (20-period SMA, 50-period SMA).
Premium
You have reached your limit of 3 free articles for this month.
Start your subscription and get access to all our original articles.
Author

Eren Sengezer
FXStreet
As an economist at heart, Eren Sengezer specializes in the assessment of the short-term and long-term impacts of macroeconomic data, central bank policies and political developments on financial assets.


