GBP/USD Forecast: Pound Sterling could encounter strong resistance at 1.2830
- GBP/USD climbed to a fresh 12-day high at 1.2800 on Tuesday.
- The pair could attract additional buyers once it clears the 1.2830 hurdle.
- Risk perception could continue to drive the pair's action ahead of Wednesday's PMI data.
GBP/USD continued to edge higher and touched its highest level in nearly two weeks at 1.2800 early Tuesday after registering modest gains on Monday. The technical outlook suggests that the pair has started to gather bullish momentum but Pound Sterling buyers could wait for the pair to clear the 1.2830 hurdle before adding to their long positions.
Following a bearish opening to the week, the US Dollar (USD) gathered strength as the benchmark 10-year US Treasury bond yield climbed to its highest level since November 2007 above 4.35%. The positive shift seen in risk sentiment, as reflected by the strong gains in US tech stocks, later in the American session limited the USD's upside.
Meanwhile, the UK's FTSE 100 Index opened in positive territory and was last seen rising 0.6% on the day, suggesting that risk flows continue to dominate the action in financial markets on Tuesday. On the same note, US stock index futures were up between 0.2% and 0.5% at the time of press, allowing GBP/USD to cling to daily gains.
Pound Sterling price today
The table below shows the percentage change of Pound Sterling (GBP) against listed major currencies today. Pound Sterling was the weakest against the Rows.
| USD | EUR | GBP | CAD | AUD | JPY | NZD | CHF | |
| USD | -0.04% | -0.13% | -0.11% | -0.43% | -0.38% | -0.44% | -0.02% | |
| EUR | 0.03% | -0.11% | -0.09% | -0.41% | -0.36% | -0.41% | -0.03% | |
| GBP | 0.12% | 0.10% | 0.00% | -0.32% | -0.26% | -0.31% | 0.07% | |
| CAD | 0.11% | 0.08% | -0.02% | -0.32% | -0.26% | -0.31% | 0.07% | |
| AUD | 0.44% | 0.43% | 0.32% | 0.32% | 0.07% | 0.01% | 0.39% | |
| JPY | 0.38% | 0.37% | 0.24% | 0.26% | -0.11% | -0.05% | 0.33% | |
| NZD | 0.42% | 0.42% | 0.32% | 0.32% | 0.01% | 0.08% | 0.40% | |
| CHF | 0.04% | 0.03% | -0.07% | -0.06% | -0.40% | -0.32% | -0.39% |
The heat map shows percentage changes of major currencies against each other. The base currency is picked from the left column, while the quote currency is picked from the top row. For example, if you pick the Euro from the left column and move along the horizontal line to the Japanese Yen, the percentage change displayed in the box will represent EUR (base)/JPY (quote).
In the absence of high-impact data releases, risk perception could continue to impact GBP/USD's action later in the day.
On Wednesday, S&P Global will release the preliminary August Manufacturing and Services PMI surveys for the UK and the US. Investors could refrain from committing to further USD weakness ahead of these data.
GBP/USD Technical Analysis
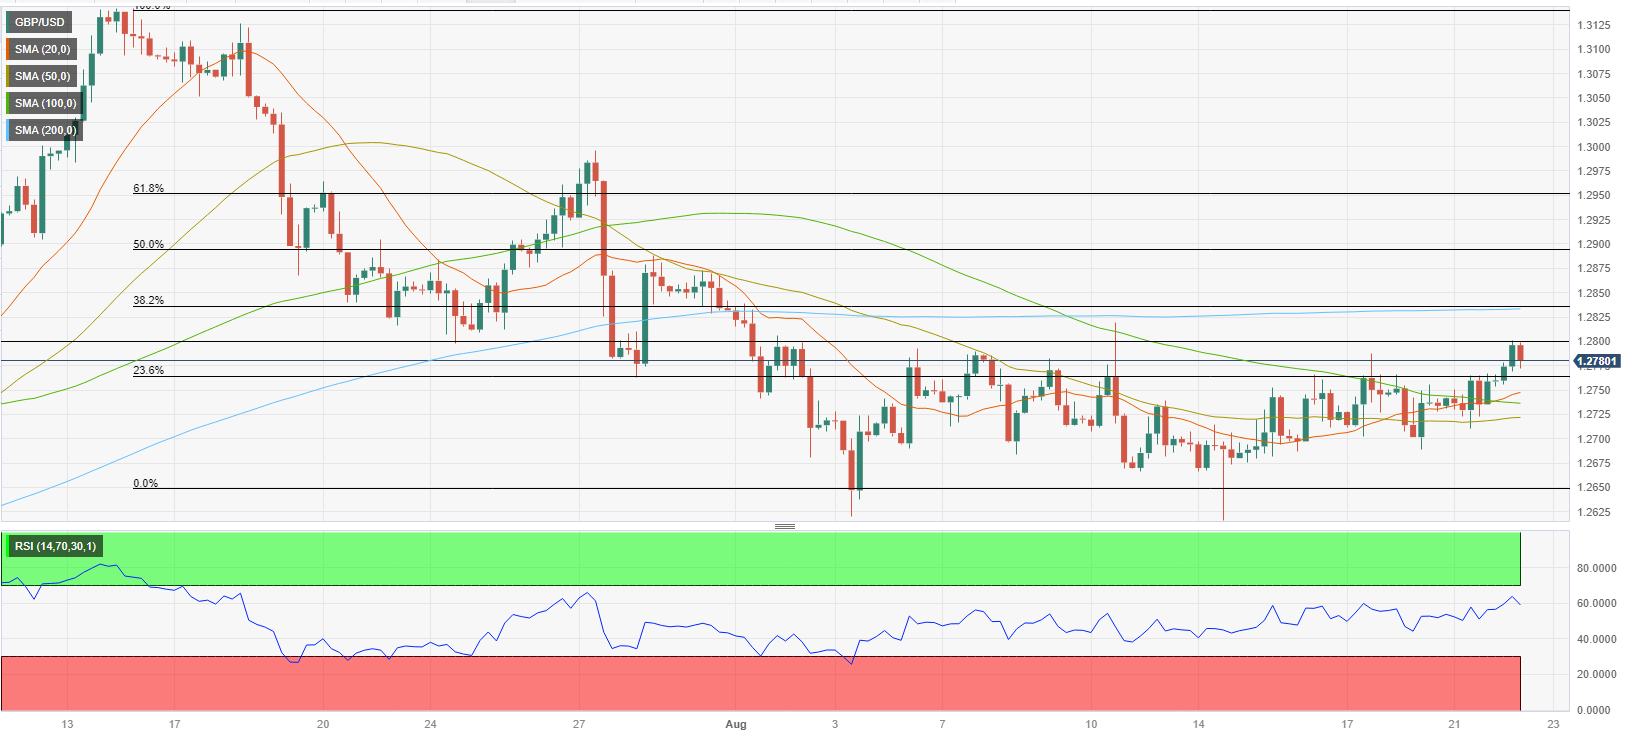
The 20-period Simple Moving Average (SMA) on the 4-hour chart made a bullish cross with the 100-period SMA and the Relative Strength Index (RSI) indicator climbed above 60 early Tuesday, highlighting the bullish bias in the near term.
On the upside, 1.2800 (psychological level, static level) aligns as interim resistance ahead of 1.2830 (Fibonacci 23.6% retracement level of the latest downtrend, 200-period SMA). In case GBP/USD stabilizes above that level, 1.2900 (psychological level, Fibonacci 50% retracement) could be seen as the next bullish target.
Looking south, first support could be seen at 1.2760 (Fibonacci 23.6% retracement). If GBP/USD returns below that level, an extended slide toward 1.2730 (100-period SMA) and 1.2700 (psychological level, static level) could be witnessed.
Premium
You have reached your limit of 3 free articles for this month.
Start your subscription and get access to all our original articles.
Author

Eren Sengezer
FXStreet
As an economist at heart, Eren Sengezer specializes in the assessment of the short-term and long-term impacts of macroeconomic data, central bank policies and political developments on financial assets.


