GBP/USD Forecast: Pound Sterling could edge lower if 1.2680 support fails
- GBP/USD trades near 1.2700 following previous week's indecisive action.
- Pound Sterling struggles to clear 1.2700-1.2710 resistance area.
- 1.2680 aligns as key near-term support for the pair.

GBP/USD staged a rebound in the second half of the previous week and erased a large portion of its weekly losses. The pair's near-term technical outlook is yet to point to a build-up of bullish momentum as it holds steady at around 1.2700 in the European morning on Monday.
The US Dollar (USD) rally forced GBP/USD to come under bearish pressure last week. The improving risk mood toward the end of the week, as reflected by the impressive rally seen in Wall Street's main indexes, however, weighed on the USD and opened the door for a decisive rebound in the pair.
Pound Sterling price today
The table below shows the percentage change of Pound Sterling (GBP) against listed major currencies today. Pound Sterling was the weakest against the Euro.
| USD | EUR | GBP | CAD | AUD | JPY | NZD | CHF | |
| USD | -0.06% | -0.02% | -0.04% | 0.02% | -0.07% | 0.09% | -0.04% | |
| EUR | 0.05% | 0.03% | 0.01% | 0.08% | -0.01% | 0.15% | 0.03% | |
| GBP | 0.02% | -0.04% | -0.03% | 0.05% | -0.03% | 0.15% | -0.01% | |
| CAD | 0.04% | -0.01% | 0.02% | 0.07% | -0.02% | 0.15% | 0.01% | |
| AUD | -0.03% | -0.08% | -0.05% | -0.07% | -0.08% | 0.10% | -0.05% | |
| JPY | 0.05% | -0.02% | 0.08% | 0.00% | 0.11% | 0.19% | 0.04% | |
| NZD | -0.12% | -0.18% | -0.15% | -0.18% | -0.09% | -0.18% | -0.16% | |
| CHF | 0.03% | -0.03% | 0.01% | -0.02% | 0.04% | -0.05% | 0.12% |
The heat map shows percentage changes of major currencies against each other. The base currency is picked from the left column, while the quote currency is picked from the top row. For example, if you pick the Euro from the left column and move along the horizontal line to the Japanese Yen, the percentage change displayed in the box will represent EUR (base)/JPY (quote).
Nevertheless, investors remain indecisive about the timing of the Federal Reserve (Fed) policy pivot ahead of this week's key growth and inflation data from the US. The CME FedWatch Tool shows that the probability of a 25 basis points rate cut in March came down to about 50% from 70% earlier in the month.
The US stock index futures trade in positive territory in the European session. In case US stocks manage to build on Friday's upsurge, the USD could weaken against its rivals during the American trading hours. The USD Index, which gained nearly 1% in the previous week, was last seen moving sideways near 103.00.
The economic calendar will not feature any high-tier data releases on Monday.
GBP/USD Technical Analysis
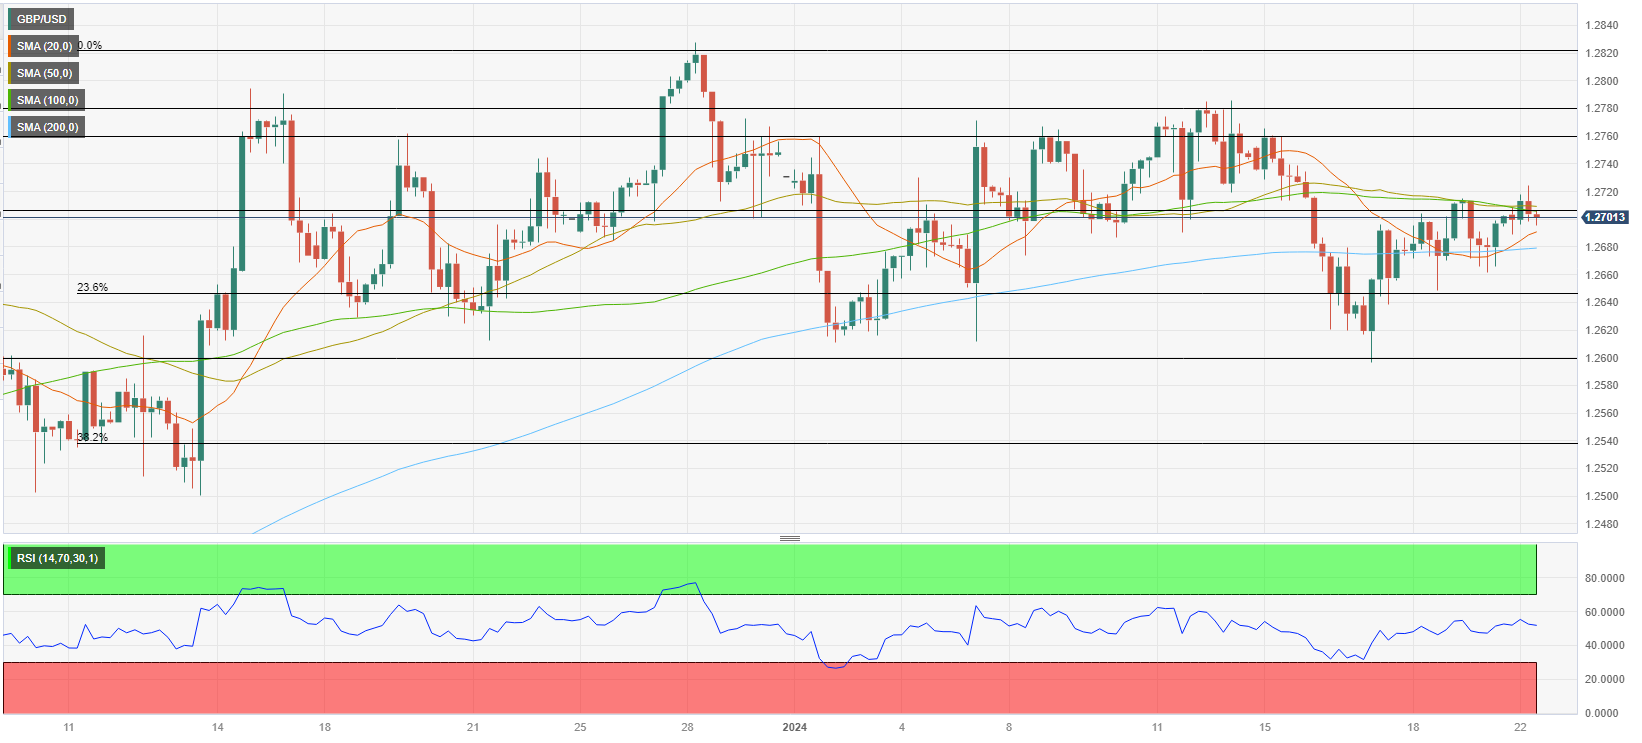
GBP/USD trades near 1.2700-1.2710, where the 20-day Simple Moving Average (SMA) and the 100-period SMA on the 4-hour chart form a strong resistance area. In case the pair rises above that area and stabilize there, technical buyers could show interest. In this scenario, 1.2760 (static level), 1.2780 (static level) and 1.2820 (end-point of the latest uptrend) could be set as next targets.
On the downside, 1.2680 (200-period SMA) aligns as key support before 1.2650 (50-day SMA, Fibonacci 23.6% retracement of the latest uptrend) and 1.2600 (psychological level, static level).
Premium
You have reached your limit of 3 free articles for this month.
Start your subscription and get access to all our original articles.
Author

Eren Sengezer
FXStreet
As an economist at heart, Eren Sengezer specializes in the assessment of the short-term and long-term impacts of macroeconomic data, central bank policies and political developments on financial assets.


