GBP/USD Forecast: Pound sellers take action as key support fails
- GBP/USD has retreated below 1.2500 in the European session.
- The pair was last seen trading below the key technical level that aligns at 1.2480.
- GBP/USD could stage a rebound ahead of the weekend on soft US inflation data.

GBP/USD has extended its slide below 1.2500 after having closed the previous two days in negative territory. The broad-based dollar strength continues to weigh on the pair early Friday as investors gear up for the US inflation data.
On Thursday, the European Central Bank (ECB) said there will be a 25 basis points rate hike in July but failed to convince markets that they will opt for a 50 bps increase in September. The shared currency came under strong selling pressure and the British pound managed to capture some of the capital outflows out of the euro. With EUR/GBP falling nearly 100 pips from session highs on Thursday, GBP/USD's losses remained relatively limited.
Earlier in the day, the Bank of England/Ipsos' latest quarterly survey revealed that the public sees inflation rising to 4.6% in the next 12 months, compared to 4.3% expected in February's survey.
Meanwhile, British Prime Minister Boris Johnson said on Thursday that he intends to introduce tax cuts "sooner than later" to ease the burden on households. "Over the next few weeks, this government will be setting out reforms to help people cut costs in every area of household expenditure, from food to energy, to childcare, to transport and housing," Johnson said but these comments failed to help the British pound gather strength.
In the second half of the day, Consumer Price Index (CPI) figures from the US will be watched closely by investors. This time around, the market reaction to the US inflation data should be pretty straightforward. A stronger-than-expected CPI, or core CPI, print is likely to provide a boost to the greenback and vice versa ahead of next week's FOMC meeting.
GBP/USD Technical Analysis
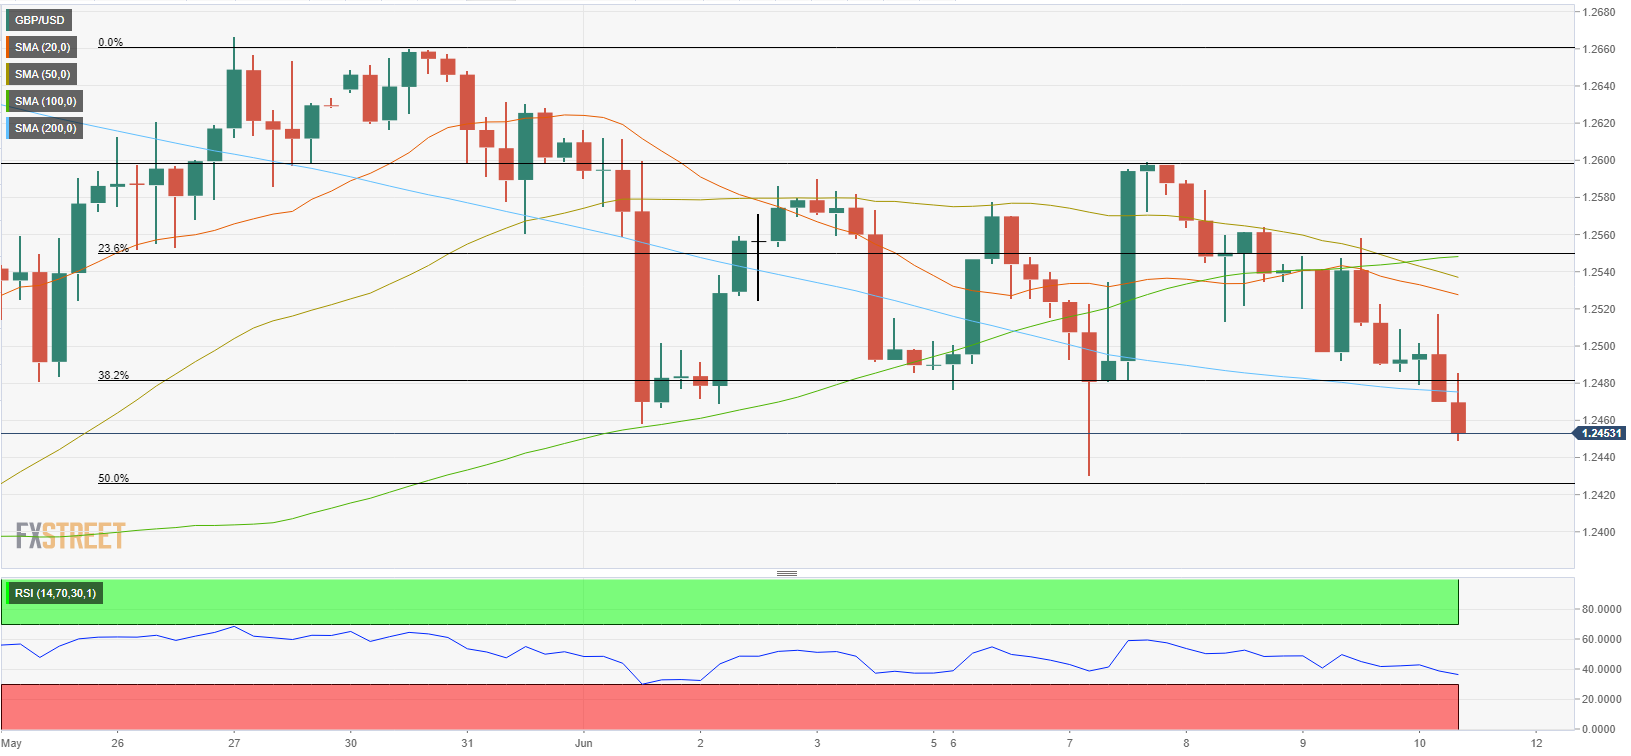
The near-term technical outlook points to a bearish tilt with GBP/USD trading below the 200-period SMA on the four-hour chart. Additionally, the Relative Strength Index (RSI) indicator on the same chart stays near 40, suggesting that the pair could continue to push lower before turning oversold and making a technical correction.
On the downside, 1.2420 (Fibonacci 50% retracement of the latest uptrend) aligns as next support before 1.2400 (psychological level) and 1.2370 (Fibonacci 61.8% retracement).
In order to shake off the bearish pressure, GBP/USD needs to reclaim 1.2480 (200-period SMA, Fibonacci 38.2% retracement). In that case, 1.2500 (psychological level) forms interim resistance ahead of 1.2550 (Fibonacci 23.6% retracement, 100-period SMA).
Premium
You have reached your limit of 3 free articles for this month.
Start your subscription and get access to all our original articles.
Author

Eren Sengezer
FXStreet
As an economist at heart, Eren Sengezer specializes in the assessment of the short-term and long-term impacts of macroeconomic data, central bank policies and political developments on financial assets.


