GBP/USD Forecast: Pound eyes 1.2400 as next bullish target
- GBP/USD has climbed above 1.2300 in the European session.
- The pair faces next technical resistance at 1.2370.
- Dollar is likely to continue to lose interest in case risk flows dominate markets.

GBP/USD has managed to build on Monday's modest gains and climbed above 1.2300 in the early European morning on Tuesday. The broad-based dollar weakness amid improving risk mood helps the pair preserve its bullish momentum.
US President Joe Biden said on Monday that they could decide whether to pause the federal gasoline tax by the end of the week. Additionally, St. Louis Federal Reserve Bank President James Bullard reiterated that the effects of the Fed's forward guidance were already taking hold on the economy and inflation.
With American investors returning from the three-day holiday, US stock index futures are posting impressive gains early Tuesday, suggesting that Wall Street's main indexes are likely to open decisively higher. In case risk flows continue to dominate the financial markets in the second half of the day, the pair could extend its rally.
The US economic docket will feature the Existing Home Sales data for May. In case this report highlights the slowdown in the housing market, investors could turn cautious and GBP/USD could find it difficult to push higher. It's also worth noting that FOMC Chairman Jerome Powell's opening statement to be delivered at the semi-annual testimony on Wednesday is likely to be released later in the day.
On the other hand, the latest remarks from the Bank of England (BOE) officials provide an additional boost to the British pound. On Monday, BOE policymaker Catherine Mann argued that a 50 basis points rate hike would reduce the risk of inflation being boosted by a weaker sterling. Similarly, BOE Chief Economist Huw Pill told Bloomberg on Tuesday that policymakers would sacrifice growth to tame inflation.
GBP/USD Technical Analysis
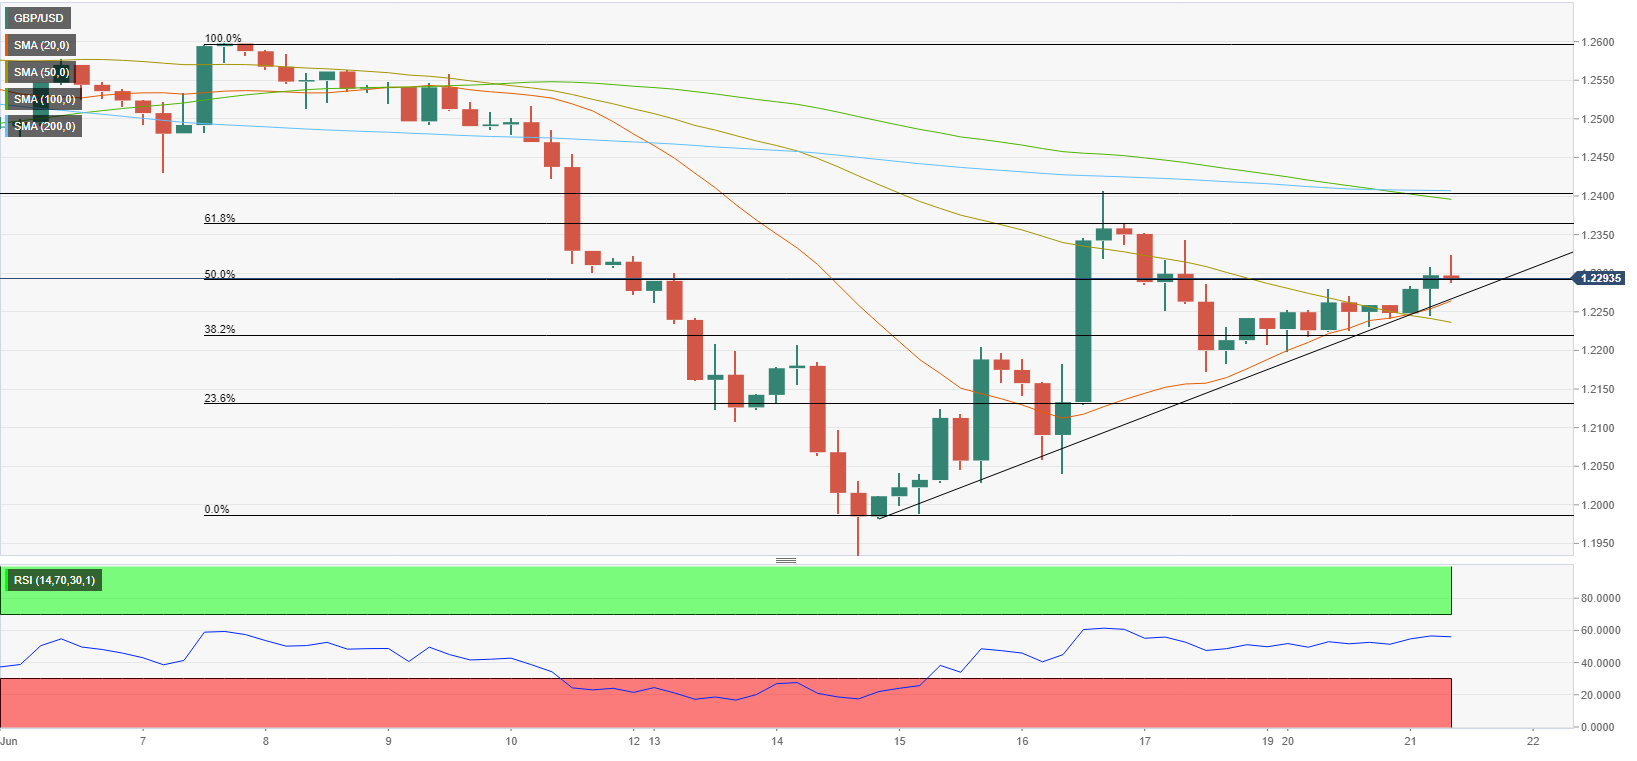
The ascending trend line coming from May 15 stays intact and the Relative Strength Index (RSI) indicator on the four-hour chart holds above 50, confirming the bullish tilt in the short-term technical outlook.
1.2370 (Fibonacci 61.8% retracement of the latest downtrend) aligns as the first hurdle ahead of 1.2400, where the 100 and the 200-period SMAs are located.
On the downside, the ascending trend line and the 20-period SMA form strong support at 1.2250. A four-hour close below that level could be seen as a bearish development and open the door for a deeper correction toward 1.2200 (Fibonacci 38.2% retracement, 50-period SMA).
Premium
You have reached your limit of 3 free articles for this month.
Start your subscription and get access to all our original articles.
Author

Eren Sengezer
FXStreet
As an economist at heart, Eren Sengezer specializes in the assessment of the short-term and long-term impacts of macroeconomic data, central bank policies and political developments on financial assets.


