GBP/USD Forecast: Pound could stage a correction before the next leg higher
- GBP/USD has extended rally to a fresh monthly high.
- Technical picture shows that the pair need to stage a correction before pushing higher.
- UK PM Johnson is reportedly not expected to announce post-Christmas restrictions this week.

GBP/USD has preserved its bullish momentum and reached its highest level since late November at 1.3388 early Thursday. Easing concerns over tighter Omicron-related restrictions in the UK and some positive Brexit headlines help the British pound attract investors but the technical picture suggests that there could be a correction before the pair can extend its rally.
Late Wednesday, the findings of a recently conducted study in Scotland and England showed that the Omicron variant was sending fewer people to hospitals than the Delta variant. Earlier in the week, investors were worried that the UK could introduce new measures to slow the spread of the virus after the Christmas holiday but this report seems to be changing that view. Additionally, Sky News said on Thursday that British Prime Minister Boris Johnson was not expected to announce post-Christmas restrictions this week.
Meanwhile, the Independent reported that the UK has reached a deal with the European Union on fishing rights and the division of quotas, providing an additional boost to the pound.
Later in the day, the Personal Consumption Expenditures (PCE) Price Index data from the US will be watched closely by market participants. Experts forecast the Core PCE to rise to 4.5% on a yearly basis in November from 4.1% in October. Although this reading is unlikely to change the Fed's policy outlook, a stronger-than-expected figure could weigh on sentiment and help the greenback stay resilient against its rivals.
The US Department of Labor will also release the weekly Initial Jobless Claims data but the risk perception is likely to continue to impact the financial markets before they turn subdued on Christmas Eve.
GBP/USD Technical Analysis
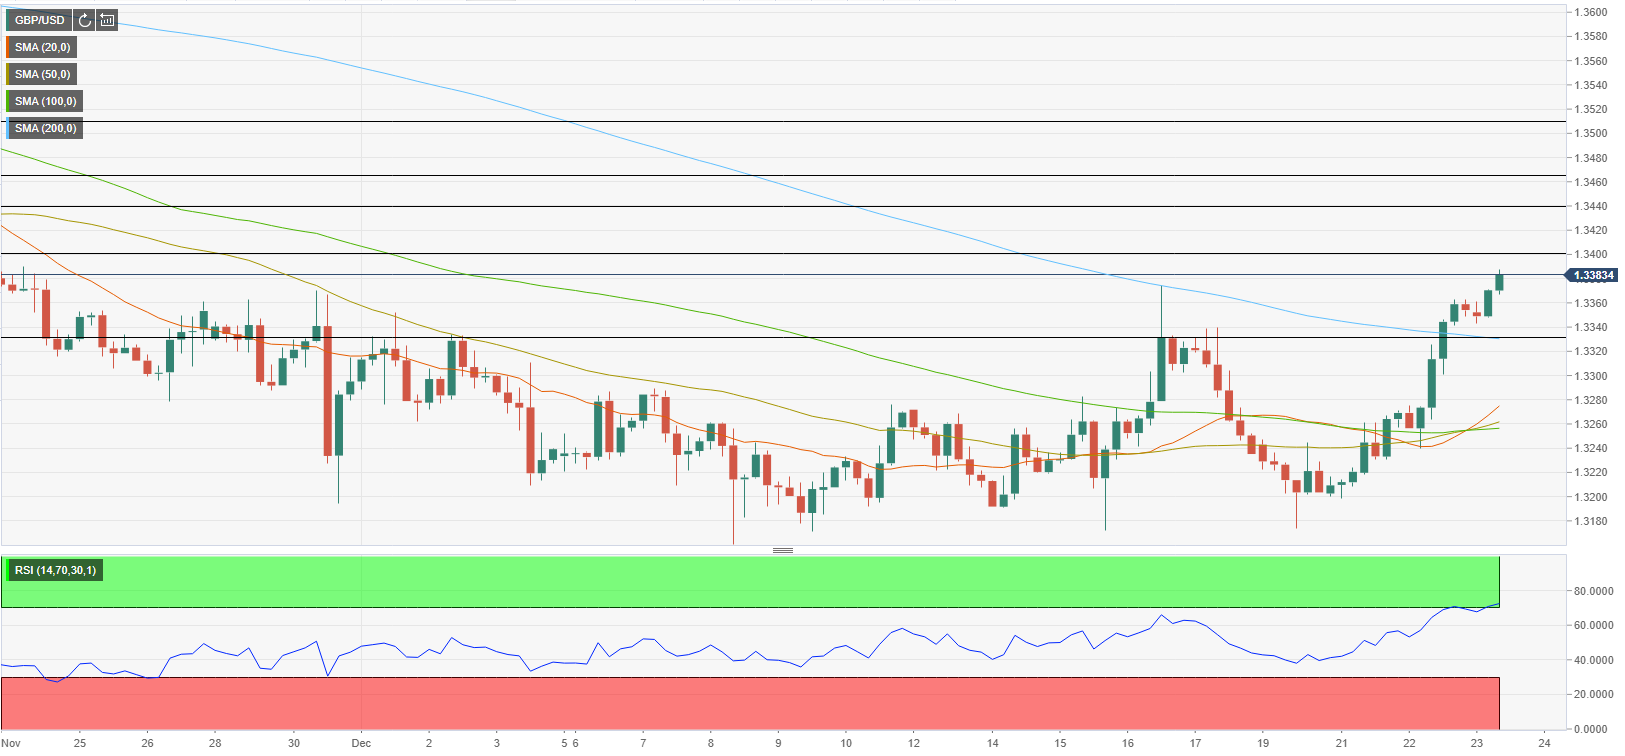
On the four-hour chart, the Relative Strength Index (RSI) indicator climbed above 70 for the first time since October 19, showing overbought conditions. The last time that happened, the pair staged a correction before regaining its traction and a similar action could be expected.
On the downside, the 200-period SMA forms the first support at 1.3330 and as long as the pair holds above that level, buyers could look to remain in control. 1.3400 (psychological level) aligns as the first target before 1.3440 (static level) and 1.3470 (static level).
Below 1.3330, 1.3300 (psychological level) is the next support before 1.3260 (100-period SMA, 50-period SMA).
Author

Eren Sengezer
FXStreet
As an economist at heart, Eren Sengezer specializes in the assessment of the short-term and long-term impacts of macroeconomic data, central bank policies and political developments on financial assets.