- GBP/USD has come under renewed bearish pressure on Friday.
- Disappointing UK data and failure of 1.3600 support points to further losses.
- Next support for the pair aligns at 1.3530.
GBP/USD has lost its traction early Friday and declined below the key 1.3600 support area, attracting bears. The near-term technical outlook suggests that the pair could extend its slide ahead of the weekend and 1.3530 aligns as the next target on the downside.
Earlier in the session, the UK's Office for National Statistics reported that Retail Sales in December declined by 3.7% on a monthly basis. This print missed the market expectation for a decrease of 0.6% by a wide margin. Although GBP/USD's initial reaction to this print was largely muted, the UK's FTSE 100 opened deep in the negative territory and weighed on the pair. As of writing, the index was losing more than 1% on a daily basis.
The US economic docket will not be featuring any high-tier macroeconomic data releases in the remainder of the day and GBP/USD could find it difficult to shake off the bearish pressure in case safe-haven flows continue to influence markets. The S&P Futures are down 0.3% during European trading hours, pointing to a bearish gap in the S&P 500 after the opening bell.
On the other hand, the benchmark 10-year US Treasury bond yield is edging lower for the third straight day on Friday, limiting the greenback's gains for the time being. Investors are likely to favour the dollar over the British pound in the current risk-averse market environment, at least in the short term, regardless of US T-bond yields' action.
GBP/USD Technical Analysis
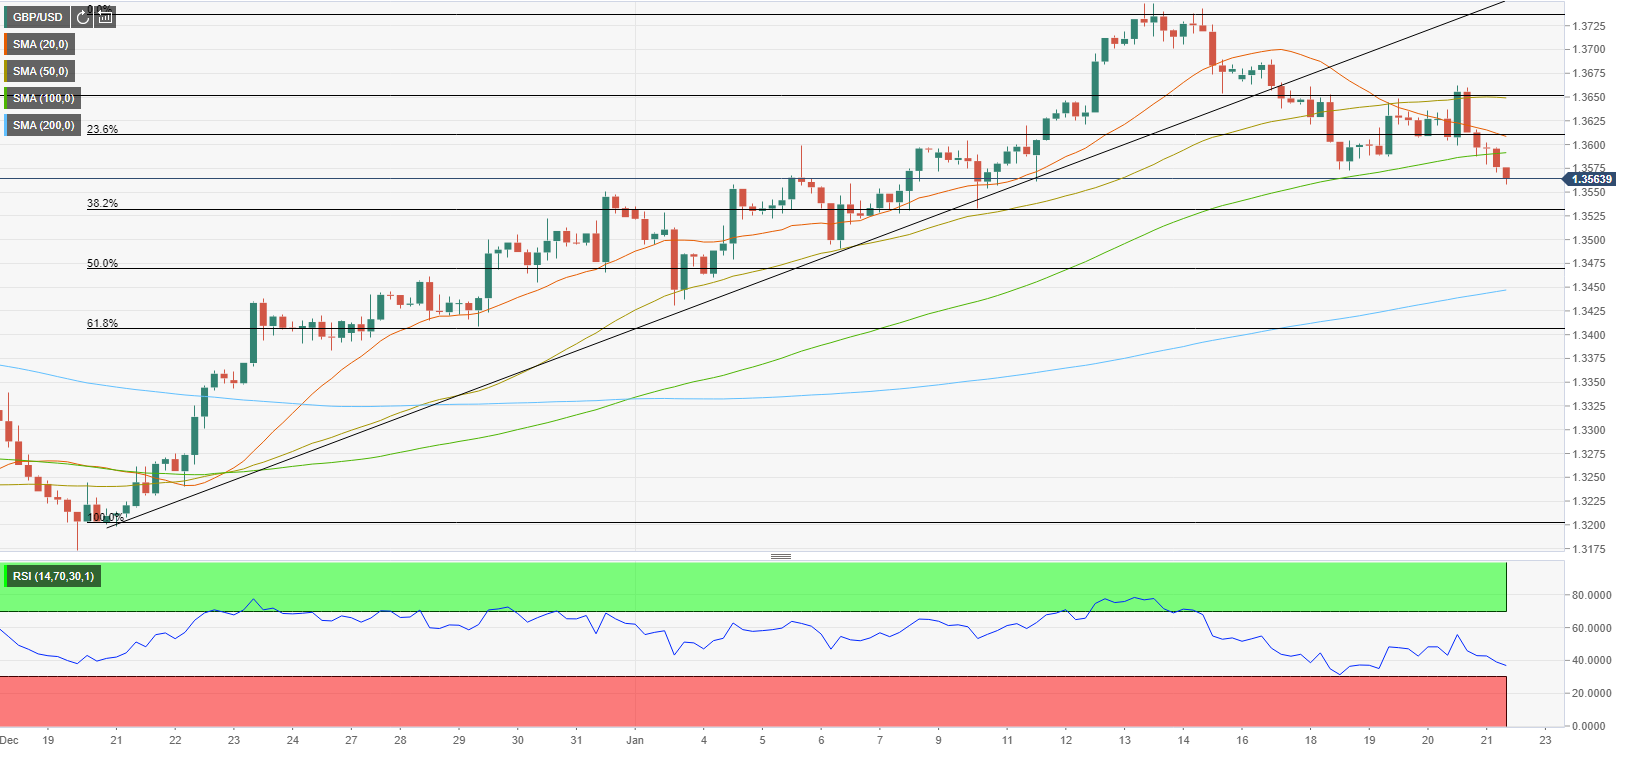
GBP/USD is trading below the 100-period SMA on the four-hour chart for the first time in nearly a month. The Relative Strength Index (RSI) indicator on the same chart is still above 30, suggesting that there is more room on the downside before the pair becomes technically oversold.
On the downside, 1.3530 (Fibonacci 38.2% retracement of the one-month-old uptrend) could be seen as the next bearish target ahead of 1.3500 (psychological level).
Resistances are located at 1.3600 (psychological level, Fibonacci 23.6% retracement, 100-period SMA) and 1.3650 (50-period SMA, static level).
Information on these pages contains forward-looking statements that involve risks and uncertainties. Markets and instruments profiled on this page are for informational purposes only and should not in any way come across as a recommendation to buy or sell in these assets. You should do your own thorough research before making any investment decisions. FXStreet does not in any way guarantee that this information is free from mistakes, errors, or material misstatements. It also does not guarantee that this information is of a timely nature. Investing in Open Markets involves a great deal of risk, including the loss of all or a portion of your investment, as well as emotional distress. All risks, losses and costs associated with investing, including total loss of principal, are your responsibility. The views and opinions expressed in this article are those of the authors and do not necessarily reflect the official policy or position of FXStreet nor its advertisers. The author will not be held responsible for information that is found at the end of links posted on this page.
If not otherwise explicitly mentioned in the body of the article, at the time of writing, the author has no position in any stock mentioned in this article and no business relationship with any company mentioned. The author has not received compensation for writing this article, other than from FXStreet.
FXStreet and the author do not provide personalized recommendations. The author makes no representations as to the accuracy, completeness, or suitability of this information. FXStreet and the author will not be liable for any errors, omissions or any losses, injuries or damages arising from this information and its display or use. Errors and omissions excepted.
The author and FXStreet are not registered investment advisors and nothing in this article is intended to be investment advice.
Recommended Content
Editors’ Picks
EUR/USD trades weak below 1.0800 amid Good Friday lull, ahead of US PCE
EUR/USD continues its downward trend for the fourth consecutive day, driven by a stronger US Dollar influenced by the hawkish market sentiment surrounding the Federal Reserve and expectations of prolonged higher interest rates.
GBP/USD: The first downside target is seen at the 1.2600–1.2605 zone
GBP/USD trades on a weaker note around 1.2620 during the early European session on Friday. The decline of Pound Sterling is backed by the growing speculation that the Bank of England will begin the rate-cut cycle this year.
Gold ends Q1 2024 at record highs, what’s next?
Gold is sitting at an all-time high of $2,236, lacking a trading impetus amid holiday-thinned conditions on Good Friday. Most major world markets, including the United States are closed in observance of Holy Friday, leaving volatility around Gold price highly subdued.
Ripple's move above this key level could trigger nearly 50% rally for XRP
Ripple price has overcome a critical resistance level and flipped into a support floor on the weekly time frame. This development happened while XRP tightly consolidated for roughly 250 days.
US core PCE inflation set to ease in February on month as Federal Reserve rate cut bets for June mount
The core Personal Consumption Expenditures Price Index is set to rise 0.3% MoM and 2.8% YoY in February. The revised Summary of Projections showed that policymakers upwardly revised end-2024 core PCE forecast to 2.6% from 2.4%.